Download
1 / 12
120 likes | 303 Views
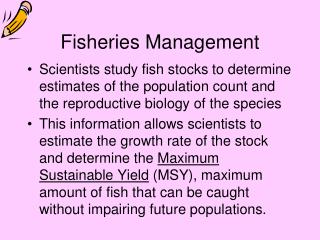
“ Application of Signal Detection Methods to the fisheries management system ”. By, Deepak George Pazhayamadom. Department of Zoology, Ecology and Plant Science (ZEPS) University College Cork (UCC), Cork, Ireland. Supervisors. Emer Rogan (Department of ZEPS, University College Cork)

E N D
“Application of Signal Detection Methods to the fisheries management system” By, Deepak George Pazhayamadom Department of Zoology, Ecology and Plant Science (ZEPS) University College Cork (UCC), Cork, Ireland Supervisors Emer Rogan (Department of ZEPS, University College Cork) Ciaran Kelly (Fisheries Science Services, Marine Institute) Edward Codling (Lecturer in Mathematical Biology, University of Essex)
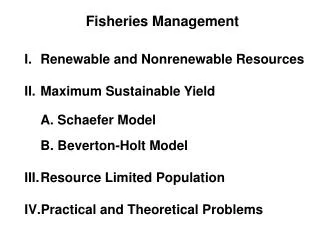
Fisheries Management (Alternative approach) Fisheries Management (Traditional approach) Stabilize Yield Maximize Yield EXISTING APPROACH SSB F Population models with assumptions Limit 1000 1.5 Precautionary 1500 0.8 Acceptable 2000 0.5 SSB, F [Estimated Indicators] (Stock abundance and Exploitation) Fishery Dependent Data: Catch (BIAS, NOISE) Fishery Independent Data: Survey (BIAS, NOISE) Monitor with Reference Limits (Acceptable, Precautionary, Limit) Statistical Signals [Stock Indicators] Next Year Regulate with output controls HCR (Eg: TAC) Other measures (Eg: Effort) Statistical Process Control
Scandol, J., 2003. Use of cumulative sum (CUSUM) control charts of landed catch in the management of fisheries. Fish. Res. 64, 19-36.Scandol, J., 2005. Use of Quality Control Methods to Monitor the Status of Fish Stocks. In: Kruse, G.H., Galluci, V.F., Hay, D.EPetitgas, P. (2009). "The CUSUM out-of-control table to monitor changes in fish stock status using many indicators." Aquat. Living Resour. 22(2): 201-206., Perry, R.I., Peterman, R.M., Shirley, T.C., Spencer, P.D., Wilson, B., Woodby, D.(Eds.), Fisheries Assessment in Data Limited Situations. Alaska Sea Grant AK-SG-05-02. ISBN:156612-093-4,pp.213-234. FISBOAT Project (Fishery Independent Survey Based Operational Assessment Tools)Petitgas, P. (2009). "The CUSUM out-of-control table to monitor changes in fish stock status using many indicators." Aquat. Living Resour. 22(2): 201-206. Mesnil, B. and P. Petitgas (2009). "Detection of changes in time-series of indicators using CUSUM control charts." Aquat. Living Resour. 22(2): 187-192. REFERENCE:
SPC (Statistical Process Control) • SPC is a statistical technique concerned with stabilizing processes to fixed targets and improvements for • Making inferences about process behaviour • Decision making Time Series Data (On Process) N = ‘1’ year N =N+1 N =N+1 Monitor Indicator Out of Control ? NO YES Correct Cause Product
Allowance Parameter (‘K’) UPPER CONTROL LIMIT (UCL) CONTROL MEAN (Cµ) UPPER CONTROL LIMIT (UCL) LOWER CONTROL LIMIT (LCL) Monitor a process using indicator/s and stabilize the system using corrective action if the control chart signals an “Out of Control” situation.
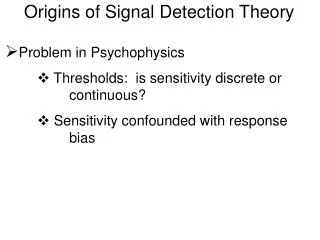
CUSUM Control Chart • Standardize each indicator • [zt=(D-µ)/σ] • D = Indicator(Time Series), µ = Control Mean, σ = Control S.D. • Standardized values (zt) are converted to Lower and Upper CUSUMs • Lower CUSUM : Ф-n = min (0, Ф -n-1 + zn + k), Ф-0 = 0 • Upper CUSUM : Ф+n = max (0, Ф +n-1 + zn - k), Ф+0 = 0 • k = Allowance parameter
K= 1 UCL Cµ Fisheries Management LCL
STEPS & GUIDELINES • Data ? • ICES Stocks • Scenarios of past events • Life histories • Define Indicators ? • Recommendations: • Empirical Indicators • Catch Data • - Age Based Numbers • - Age Based Weight • - Proportions • Recommendations: • Relationship with SSB • Best Matches (Correlations) • Use of Combined Indicators • Best Indicators ? • PHASE I: (Reference Period) • From all available data • Moving Average • SSB levels • Control Mean (‘µ’) ? • Control Limits (‘h’) ? PHASE II: (Tune CUSUMs) IC-ARL, OC-ARL • Inherent variability (‘k’) ? Phase III: Action ? Best Strategy or HCRs • HCR ?
Illustration CUSUM with HCR Data : Greenland Halibut in Subareas I and II (1964-2006) Simulation : Age Structured Population Numbers for 100 years (1995 onwards) Exponential Decay and Catch Equations were used. Average Fishing Mortalities (1964-2006) with variation (C.V.=0.2) Iterations : 1000 CUSUM Reference Period : 1980-1989 Indicators : CN6,CN11 Allowance (k) : 1 Reference Limit (h) : 1 Action : Triggered with Lower CUSUM Limit HCR : 20% to 50% reduction in Fishing Mortality (Random) Reference: James, L. J., (2008). M.Sc. Thesis, ‘Use of cumulative sum (CUSUM) control charts of empirical indicators to monitor the status of fisheries in the North-east Atlantic’ Potential Indicator: CN11 CN6 r= 0.09310228 CN11 r= 0.90395651
Illustration CUSUM with HCR CN6 r= 0.09310228 CN11 r= 0.90395651
Project Outline To develop a theoretical management framework based on HCR that use SPC methods with indicators from number of stocks to successfully manage model fisheries at the ecosystem level. TASK 1 Define Indicators TASK 2 Find Best Indicators TASK 3 Control Mean TASK 7 Multiple Stocks and/or Ecosystem Interactions Single Species Simulation Framework TASK 4 Control Limits TASK 4 Allowance TASK 5 Performance Evaluation TASK 6 Evaluate model HCRs