Download
1 / 29
300 likes | 520 Views
UNCERTAINTY ANALYSIS OF LONG TERM WIND SPEED PREDICTION ALEX KAPETANOVIC MANAGER WIND DATA ANALYSIS 14 TH SEPTEMBER 2010. Wind Speed Prediction Overview. Long Term Estimate. Historic Estimate. Site Measurements. Wind Farm Site. Concurrent Period Relationship.

E N D
UNCERTAINTY ANALYSIS OF LONG TERM WIND SPEED PREDICTION ALEX KAPETANOVIC MANAGER WIND DATA ANALYSIS 14TH SEPTEMBER 2010
Wind Speed Prediction Overview Long Term Estimate Historic Estimate Site Measurements Wind Farm Site Concurrent Period Relationship Historic Reference Measurements Reference Stn. Time
Problem Overview • Not all predictions are equal… • The uncertainty in a wind speed prediction depends on: • The site / reference relationship usually varies by season, yet traditionally this has seemingly not been explicitly included some are more equal than others Wind Speed Prediction Uncertainty Annual variability of the historic & measured data Extrapolation to hub height Annual variability of the future forecast period Quality of the measured data Quality of the relationship ?
Problem Overview • This presentation focuses on: Wind Speed Prediction Uncertainty Annual variability of the historic & measured data Inter-annual Variation Extrapolation to hub height Annual variability of the future forecast period Quality of the measured data Quality of the relationship
TECHNICALLY THOUGH, THE QUALITY OF THE RELATIONSHIP IS DEFINED BY: The confidence limits of the estimated model parameters The number of data points Quality of the Relationship • GOOD INDICATORS MIGHT BE: • A trusted method (indicated by prior studies) • Good ‘r’ value, but be careful • ‘r’ increases when averaging over a larger timescale, e.g. r Hourly <= r Monthly • Even if ‘r’ = 1, the uncertainty in the prediction is not negligible
An Example : Least Squares • It is “easy” using classical theory to develop the uncertainty in some relationships… • e.g. in the relationship y = m x + b: Time series of Reference Stn. data (x) and Measured Data (y) Intermediate calcs. Slope Offset Regression coefficient
An Example : Least Squares Continued • What is the error on m and b? • Standard practice assumes that the number of points ‘n’ is large enough to apply the Central Limit Theorem, which in turn implies that the errors in regression are normally distributed Where tn-2% represents the % quantile of Student’s t-distribution and the confidence level of the errors
An Example : Least Squares Continued Confidence Level What does that mean? Look up table for % quantile of Student’s t-distribution and error confidence level For most wind predictions one can assume an infinite number of points Data Points minus 2 • Example: • y = 1.1881x + 2.1583 • Mean at reference station, x = 5.66m/s • Stdev(m) = 0.01127 • Stdev(b) = 0.07025 • tn-2 from table is 1.65 • Error • =((0.01127*1.65*5.66)+(0.07025*1.65))/(1.1881*5.66+2.1583) • =2.5% Unfortunately empirical evidence suggests that this calculation underestimates the true error
Uncertainty in Other Methods Not so easy to calculate uncertainty in other cases, e.g. the non-linear ‘matrix method’ In such cases the uncertainty can be evaluated using empirical methods RES uses the following relationship to evaluate the uncertainty in all of its predictions [1] Derived from a ‘bootstrap’ method Where ‘n’ is the number of hours used to define the relationship [1] http://www.res-americas.com/Resources/MCP-Errors.pdf
Multiple masts Example Ref Stn Mast 1 Mast 2 Time • First predict Mast 1 in the normal way using a reference station • Now compare two possible approaches for predicting Mast 2 • How do we evaluate which method gives the lowest uncertainty for Mast 2? Method 2 “Second Step” or “Intra-site” prediction Method 1 Same method as used for Mast 1 Ref Stn Mast 1 Mast 2 Ref Stn Mast 2
Evaluating “Second-step” Uncertainty • In a similar study we determined the following relationship: Method 1: Mast 2 has 1 yr of data Method 2: Mast 2 has 1 yr, Mast 1 has 1.5 yrs Method 2: Mast 2 has 1 yr, Mast 1 has 2.0 yrs Method 2: Mast 2 has 1 yr, Mast 1 has 3.0 yrs
EXTRAPOLATION OF WIND SPEED FROM MEASURED HEIGHT TO HUB HEIGHT sHH
Shear Extrapolation Uncertainty Shear Exponent α defined by: The error in the shear exponent is : The Shear Extrapolation Uncertainty : is derived from And yields The commonly applied rule “1% for 10m of extrapolation” is too generic… Insufficient vertical separation between anemometer levels leads to higher uncertainty
ANNUAL VARIABILITY OF WIND SPEED IN THE REGION (INTER-ANNUAL VARIATION) sIAV
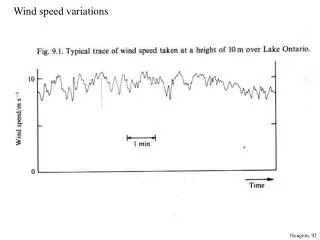
Annual mean wind speed varies on a yearly basis IAV (“Inter-annual Variation”) is defined as the standard deviation of the annual means divided by the overall mean More variation requires a longer measurement campaign for a given uncertainty Not all regions in the United States have the same amount of variability Is the value of 6% that is typically used “representative”? Annual Variability
Based on 10 years of NCEP Reanalysis Surface Winds (2000-2009) Annual Variability • Numerical weather prediction model output • Global 2.5 deg grid (~200km in lower 48) • “Surface” wind speed is at sigma level 0.995 Data are here: http://www.esrl.noaa.gov/psd/data/gridded/data.ncep.reanalysis.derived.surface.html
Annual Variability • Recent work presented here for the first time shows the variation of IAV across the United States based on over 8000 US surface stations • Here those with a 10 year record are presented un-filtered (700 stations) Data are here: ftp://ftp.ncdc.noaa.gov/pub/data/gsod/
Annual Variability • Simple filters were then applied after which 251 stations remained • Every day had to have a minimum of 22 hours to ‘count’ • Each year had to have a minimum of 90% availability over 10 years (2000 – 2009)
Problem: Many stations exhibit discontinuities Annual Variability Add some more data and …. Add 1 more year and the IAV jumps to ~5.7% After ~7 years the cumulative IAV has settled to less than 3% and remains ~constant out to 16 years Thunder Bay, Ontario
How do we know that these stations were valid over the period without examining them all ‘by hand’? Statistical procedure to remove the outliers was used Calculate the first (Q1) and third (Q3) quartiles of the observed 10-year series, i.e. the 25th and 75th percentiles Calculate the Inter-Quartile Range: IQR = Q3 – Q1 Define boundaries above and below which points are considered to be outliers: Upper Bound (UB) = Q3 + k * IQR Lower Bound (LB) = Q1 - k * IQR Taking k = 3 (a commonly used value in statistics for extreme outliers) reduced the number of stations to 234 Using a cumulative sum technique 3 more stations were removed because they had step changes, or changes in the mean level (outside of defined limits) Annual Variability
Annual Variability 231 Valid Stations Only a small portion of the US appears to have an IAV of 6% or greater
Annual Variability • A minor problem with this result is that we know that stations have inconsistencies: • ASOS stations start ~1996-1998 or later • AWOS stations start 2002-2003 or later • ASOS stations switched to Ice Free Instrumentation between 2002-2009 • No stations were left with a 10 year record if filtered using the criterion that the station had not changed • However, ‘inconsistency’ should tend to increase IAV, so we believe that the map is valid
Annual Variability NCEP 231 Valid Stations
Conclusions • Seasonality is not accounted for in a classical approach to the Quality of the relationship • However, seasonality can be accounted for in empirical estimations of the Quality of the relationship. Quality of the relationship
Conclusions • The 1% per 10 meter rule of thumb is just that. It needs to be evaluated on a case by case basis • Insufficient vertical separation between anemometers used for calculating shear leads to higher shear extrapolation uncertainty Extrapolation to hub height
Conclusions • The NCEP Reanalysis Surface Winds map indicates that only a few regions might have an annual variability greater than 6% • Analysis conducted on 231 ground stations shows that much of the US has an IAV closer to 4% and only a very small portion of the US is >=6% Inter-annual Variation
THANK YOU ALEXANDRE KAPETANOVIC MANAGER, WIND DATA ANALYSIS RENEWABLE ENERGY SYSTEMS AMERICAS INC. 11101 West 120th Avenue, Suite 400 BROOMFIELD, CO 80021 (303) 439 4200 With thanks to Gail Hutton, Brian Healer, Andrew Oliver, Dan Ives, Kristofer Zarling, Jerry Bass & Mike Anderson