Download
1 / 9
90 likes | 110 Views
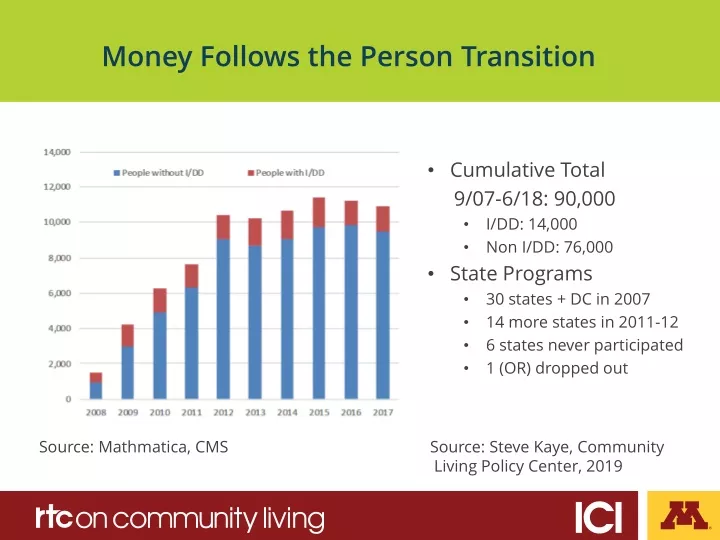
Explore cumulative totals from 2007 to 2018 with 90,000 transitions, including 14,000 I/DD cases, and 76,000 non-I/DD cases. Learn about state programs in 30 states and D.C. since 2007, as well as updates in 2011-12. Find out which 6 states never participated or dropped out. Sources include Steve Kaye, Mathmatica, ICI surveys, and more. Discover statistics on decision-making in Colorado, such as choosing living arrangements and daily schedules. Gain insight into self-directed support services.

E N D
Money Follows the Person Transition Cumulative Total 9/07-6/18: 90,000 I/DD: 14,000 Non I/DD: 76,000 State Programs 30 states + DC in 2007 14 more states in 2011-12 6 states never participated 1 (OR) dropped out Source: Steve Kaye, Community Living Policy Center, 2019 Source: Mathmatica, CMS
Number in Employment and Day Services Source: ICI National Survey of State IDD Agencies
Funding for Employment Services (IDD agencies) Source: ICI National Survey of State IDD Agencies
Public Expenditures on IDD Supports and Services in the US: 1977-2014 Source: Tanis, Lulinski, Wu, Braddock, & Hemp (in preparation). Univeristy of CO
Choose Home The proportion of people who reported they chose or had some input in choosing where they live if not living in the family home Total respondents Colorado: 189 NCI Average: 11,213 Source: NCI, 2019 Adult Consumer Survey, 2016-17 Final Report
Choose Housemates The proportion of people who reported they chose or had some input in choosing their housemates if not living in the family home. 2016/17. Source: Source: NCI, 2019 Adult Consumer Survey, 2016-17 Final Report Total respondents Colorado: 189 NCI Average: 11,213
Decides Daily Schedule The proportion of people who decides or has help deciding their daily schedule. 2016/17. Source: Source: NCI, 2019 Adult Consumer Survey, 2016-17 Final Report Total respondents Colorado: 375 NCI Average: 19,420
Chooses What to Buy with Their Spending Money The proportion of people who has help choosing what to buy or has set limits on what to buy with their spending money. 2016/17. Source: Source: NCI, 2019 Adult Consumer Survey, 2016-17 Final Report Total respondents Colorado: 397 NCI Average: 19,312
Uses a Self-Directed Support Option The proportion of people who are currently using a self-direct support option (”Yes” only may be from state options). 2016/17. Source: NCI, In-Person Survey, Final Results www.nationalcoreindicators.org/resources/reports/