Download
1 / 14
140 likes | 252 Views
Learn how companies use the Markov Process to forecast market positioning, the theory behind this method, and its limitations due to external factors. Explore practical examples and matrices to grasp its application and workings.

E N D
The Markov Process Math 123 Spring 2009 Grace Roy and Mary Beth Moyer
The Markov Process • What is it / Why is it used? • Why does it work (in theory)? • Example 1 • Example 2
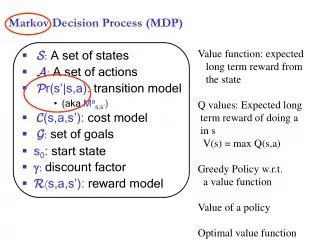
What is it / Why is it used? • The Markov Process can be used by companies to determine their long term position in a given market. • It is a process that uses known percentages of business that a company has from multiple time periods. • This point of equilibrium (when each company has reached its consistent control of a market) is found when a state vector (a comparison between companies at any given point in time) is multiplied by a transition matrix (a consistent comparison between companies that does not change with time).
How Does It Work (Or Not)? • The Transition Matrix, when multiplied by the state vector can determine the state vector for the subsequent time period. When the resulting vector is continually multiplied by the transition matrix ultimately an equilibrium point will be reached for each company. • From the initial state vector it is possible to determine a state vector at any point in time
How Does It Work (Or Not)? cnt. • On occasion a point of equilibrium cannot be reached. • In reality however the Markov Process is not accurate because of external factors over which the companies have no control (i.e. changes in economy, changes in demographics of customers, or new competition etc.).
Example 1 • Amato’s opens in Farmington causing there to be three places to get pizza downtown: Farmington House of Pizza, The Snack Shack, and the new Amato’s.
Before the new Amato’s opens, obviously they have 0% of student business. Since the Snack Shack is right on campus, it has the majority of business at 65% and the FHOP has the remaining 35%. So the First day is before Amato’s opens and day two is the grand opening.
This table is the State Vector gives us the business on day 1, from which we can determine all subsequent days. The transitional matrix which is based in Amato’s perspective of business they will keep, and business they will gain from the FHOP and the Snack Shack. So T may look like this:
Example 1 Matrices Transition Matrix Initial State Vector State Vector .60 .15 .10 .25 .75 .05 .15 .10 .85 0 .35 .65 .117499 .294990 .587500 * = In multiplying the new state vector each time by the transition matrix we ultimately discover Amato’s gets 23% of business, FHOP gets 30%, and the Snack Shack gets 47%.
The point of Equilibrium • After one week, the Markov Process reaches an equilibrium point which indicates the long term customer distribution. In this example, the point of equilibrium demonstrates the percentage of customers:
Example 2 In the past year the customer choices have been followed between Wal-Mart, K-Mart, or neither. This table describes Wal-Mart’s control over the market in the past year, compared to K-Mart and consumers who chose neither Wal-Mart nor K-Mart.
When Wal-Mart changes its prices the distribution of customers starts to change. This table reflects the first three days after Wal-Mart has changed its prices.
Example 2 Matrices Transition Matrix Initial State Vector State Vector .40 .25 .60 .50 .50 .30 .10 .25 .10 .73 .20 .07 .383999 .485999 .130000 * =
When the Transition Matrix is multiplied by the changing state vector, the Markov Matrix reaches an equilibrium after three days.