3-5 Historial Data Points
210 likes | 344 Views
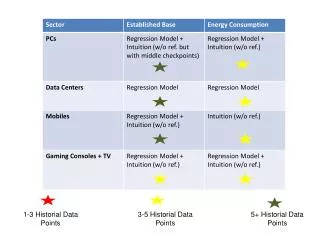
1-3 Historial Data Points. 3-5 Historial Data Points. 5+ Historial Data Points. Types of Regression Models. Following types of regression models were considered Logarithmic – ln(x) Linear – ax+b Quadratic – ax 2 +bx+c Polynomial – a 1 x n + a 2 x n-1 + .. + a n x + c Power - a bx

3-5 Historial Data Points
E N D
Presentation Transcript
1-3 Historial Data Points 3-5 Historial Data Points 5+ Historial Data Points
Types of Regression Models • Following types of regression models were considered • Logarithmic – ln(x) • Linear – ax+b • Quadratic – ax2+bx+c • Polynomial – a1xn + a2xn-1 + .. + anx + c • Power - abx • Exponential - aex • Combination of above families
Example of Regression Models Exponential Polynomial Linear Power Logarithmic
Important Assumptions on PC Sector Established Base • The PCs sector was divided into two main sectors: • Desktop PCs • Laptop PCs • Percentage share of each sector was in accordance with the Smart2020 report • In 2002, • desktop had 84% of market share • Laptops had 16% of market share • By 2020, • laptops taking 74% of market share • Desktops have 26% of market share • linear increase in use of laptops was assumed
Important Assumptions on PC Sector Established Base Computation – Case I • PC sales numbers from Gartner are used to estimate the established base • Needs an accurate estimate of PC life cycle to get the established base • Three scenarios showing the life cycle of PCs are obtained • 3-year “typical” life cycle as mentioned in Gartner news release • 4-year life cycle derived from Gartner’s “1.1 Billion PCs in Use in 2008” statement • 5-year life cycle for laptops and 6-year life cycle for desktops as mentioned in “European Commission DG TREN : Personal Computers (desktops and laptops) and Computer Monitors • Can be obtained at www.ecocomputer.org • Plugging in the recent data (2009 and 2010(est.)) from Gartner Inc. gave different estimates than before • Estimating PC life cycle as 3 or 4 years gave surprisingly low estimates even with the most aggressive curve fit (exponential growth) • 2.75 Billion PCs in 2020 for 3 year life cycle • 3.6 Billion PCs in 2020 for 4 year life cycle • Estimating PC life cycle of 5 years gave the most reasonable estimate of PC established base • Closely matches Smart2020 established base prediction of 4.067 Billion PCs by 2020 • A reasonable 50% PC penetration by 2020 • 4.3 Billion PCs in 2020
Important Assumptions on PC Sector 3-Year Life Cycle 4-Year Life Cycle
Important Assumptions on PC Sector 5-Year Life Cycle
Important Assumptions on PC Sector Established Base Computation – Case II • Internet Users numbers from CIA World Factbook to derive PC established base • Assume number of internet users to reflect PC base closely • Non-internet connect PCs and sharing of PCs cancel each other out maybe? • Only 3 world data points but gives very good curve fit as the data points are spread over a long period • 2002, 2005 & 2008 years estimates • Gives an estimate of 5.75 Billion Pcs by 2020
Important Assumptions on PC Sector Energy Consumption • To estimate the energy consumption of a PC, its operation was divided into 3 different modes: • Active mode – when PC is on and CPU is functioning • Sleep mode – when CPU is on standby • Off mode – when CPU is off but is plugged into the socket • Usage patterns for different modes of operation are obtained from TIAX from the report submitted to the US Dept. of Energy. • The usage pattern values was based on data of year 2005 • Lower bound estimate that usage in future years will be at least as much as 2005 was made • Sleep & Off modes power consumption from the ENERGY STAR ratings • The latest energy star ratings was used to define the lower bound on sleep and off mode power consumption • All PCs are assumed to satisfy Energy Star ratings • As the top 5 models PC power numbers weren’t available, the active PC power consumption of some popular models listed in following websites was used • Univ. of Pennsylvania, Information Systems and Computing • Apple Energy and Environment website • White paper “Review of Computer Energy Consumption and Potential Savings” sponsored by Dragon Systems Software Limited. • Note: Lowest values of power consumption were taken • for having lower bound estimates for the energy consumption
Important Assumptions on PC Sector Energy Consumption • All the power consumption analysis was done independently for desktops and laptop PCs • decrease in power consumption of desktops – polynomial fit • in accordance with the historical trends observed • Two curves showing both increase and decrease in power consumption of laptops – polynomial fit • Ambiguous historical data in which some models have increased energy consumption while some show a slight decrease
Important Assumptions on Data Center Sector Established Base Energy Consumption • Established base numbers till 2020 were extrapolated based on Gartner and Koomey’s reports • Matched Smart 2020 report’s extrapolated establised base numbers • A linear increase in energy consumption of data centers was assumed • As opposed to Smart2020’s view of no increase in energy consumption • Equal energy consumption for running and cooling the data center was assumed for all extrapolations • In accordance with assumption by Koomey et al. • Half the energy consumption of data centers is assumed to be from electronics usage • The other half is by cooling
Important Assumptions on Mobile Sector Established Base Computation – Case I • Only mobile devices have been considered in this study • Other telecom devices not considered • Like IPTV boxes, broadband modems • Telecom infrastructure was not considered • Extrapolations using curve fitting were done based on the historical data of Gartner Inc. • Life cycle of a mobile phone was assumed to be 3 years • 2009 data from Gartner was used as well • Best regression model gives an estimate of 6.5 Billion established mobile base by 2020
Important Assumptions on Mobile Sector Established Base Computation – Case II Linear Regression • Extrapolations using curve fitting were done based on the data from CIA World Factbook. • Best regression models give an estimate of 20-50 Billion established mobile base by 2020 • Two reasonable fits were found • Linear model gave 11 Billion established base • Power model gave 7.3 Billion established base • To decide on the growth trends, the basket approach was used • Was not conclusive
Important Assumptions on Mobile Sector Established Base Computation – Case II Power Regression
Important Assumptions on Mobile Sector “Basket” Approach Best Fit - Polynomial Total established base for these countries is 12 Billion by 2020!!
Important Assumptions on Mobile Sector “Basket” Approach Linear Fit – 97.2% accurate Total established base for these countries is 5.5 Billion by 2020 Power Fit – 91.2% accurate Not Conclusive!
Important Assumptions on Mobile Sector Energy Consumption • For the mobile phone power consumption • Energy consumption of a device is equal to the battery energy storage capacity • Different values based on charging frequency were given • lower bound estimate: charging once in two days • Average estimate: charging once a day • Higher bound estimate: charging twice a day • Doesn’t impact the total values by much as Mobile sector energy consumption is negligible compared to other sectors • Popular Nokia models were only considered for obtaining the energy consumption per device • As most of the similar cellphones have the same battery capacity
Important Assumptions on Gaming Sector Established Base Energy Consumption • Extrapolations using curve fitting were done based on the historical data of NPD group and VGChartz • A quadratic increase in established base is assumed • Gives a reasonable 700,000 game consoles by 2020 • Number of televisions is same as the video game consoles in that year • As televisions are assumed to be used with gaming consoles in our analysis • Power consumption values were obtained from: • The Energy Saving Trust, “The ampere strikes back” • Detailed power consumption of various popular gaming consoles • Different modes of power consumption • Projections to power consumption were assumed to increase logarithmically • Gave a reasonable 250 watts per device by 2020 • Linear increase gave unreasonably high 800Watts per device by 2020 • Usage statistics of gaming device was obtained from Consumer Electronic Association (CEA) • Alternate scenarios with higher gaming device usage will be plotted as well
Important Assumptions on Gaming Sector Energy Consumption • Weighted average of the different gaming consoles based on their market share was done • to obtain the energy consumption per device • Different power modes were considered • Television power consumption was based on ”Efficiency standards for televisions”, California Energy Commission, 2008. • Television power consumption is assumed to be decreasing over the years • An constant average TV screen size 26” is taken for all extrapolations
Our Projections on Total Energy Consumption of ICT Sector Will be updated based on case choice Total energy consumption in (billion KWhrs/yr)
Our Projections on Carbon Footprint of ICT Sector Will be updated based on case choice Total carbon footprint in (Mega tonnes of CO2) *Embodied carbon & Telecommunications Infrastructure has been ignored in this analysis