
100
100. 96. 92. 88. 80. 72. 60. SO. 2. %. 100. 96. 92. 88. 80. 72. 60. SO 2 imaging in pulmonary microcirculation. Arteriole. Venule. SO 2 (%). 100 m. 100 m. 94+3. 100 m. 100. 21%. 96. 92. 88. 80. 72. 100%. 11%. 60. Variation of inspiratory O 2 fraction.

100
E N D
Presentation Transcript
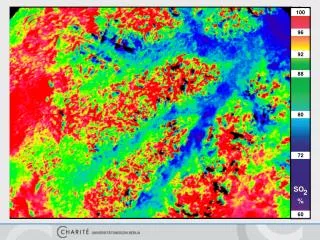
100 96 92 88 80 72 60 SO 2 %
100 96 92 88 80 72 60 SO2 imaging in pulmonary microcirculation Arteriole Venule SO2 (%) 100m 100m
94+3 100m 100 21% 96 92 88 80 72 100% 11% 60 Variation of inspiratory O2 fraction O2 SvO2 (%) SaO2 (%) 21% 76+2 100% 85+2 100+0 11% 36+5 76+4 n=4 SO2 (%)
Flow velocity in the pulmonary microcirculation Branching point 5 4 3 Arteriole Venule Blood Flow Velocity (mm/s) 2 Capillary 1 0 -100 0 100 200 Distance (m)
SO2 profile over travelled distance 100 Capillary Venule 90 Arteriole Hemoglobin oxygen saturation (%) 80 Branching point 70 0 -100 0 100 200 Travel distance of RBC (m)
SO2 profile over travel time Venule 100 Capillary 90 Arteriole Hemoglobin oxygen saturation (%) 80 S. Silbernagl et al.: Physiology 70 0 0 100 200 Travel time of RBC (ms)


