Download
1 / 19
200 likes | 438 Views
Impact of Icing and Turbulence on Safe Separation. Andrew Mirza, Met Office 18th September 2007. Content. Scenario 1: unexpected change in vertical separation Weather Information Management Systems CAT Object Data Scenario 2: unplanned changes in separation ICE Object Data Summary

E N D
Impact of Icing and Turbulence on Safe Separation Andrew Mirza, Met Office 18th September 2007
Content • Scenario 1: unexpected change in vertical separation • Weather Information Management Systems • CAT Object Data • Scenario 2: unplanned changes in separation • ICE Object Data • Summary • Contact Details
This scenario illustrates an incident that caused aircraft vertical minimum separation to be violated due to clear air turbulence. Two aircraft P and Q enter North Atlantic Track E both are approved for RVSM and are cleared for 0.82 Mach. Aircraft P is at FL370 and Aircraft Q is at FL360. Aircraft P is slowly overtaking Q. Atmospheric HazardsScenario 1 - Turbulence
Atmospheric HazardsScenario 1 - Turbulence • Analysis of this event • Instruments on both aircraft indicated their presence and proximity to each other. • Initially separation was reduced by transient variations in vertical speed due to turbulence but this was low risk as vertical separation was still adequate. • Incident became serious 10 seconds later when Aircraft Q’s flight controls initiated a “vigorous climb” which resulted in it passing through Aircraft P’s flight level. • Although TCAS alerts were issued in both aircraft, for Aircraft Q these may not have been noted because of other concurrent alerts and warnings, in particular the crew may have been pre-occupied by the loss of auto-pilot control due to an over-speed condition. • Mitigation of this event • First we will look at the weather information available today for turbulence forecasts then compare how systems being developed in FLYSAFE could enhance this information and indicate how this extra information could mitigate this event.
WAFC Significant Weather Chart • The weather information each crew had available included the SigWx Chart, which depicts areas where CAT is forecast. • SigWx Charts are issued four times daily and are based upon 24 hour forecast model. • They are issued approximately 16-17 hours before the time at which they are valid. • SigWx are snapshots valid at 00, 06, 12 and 18Z whilst a chart is valid at a particular instance in time, e.g., at 12Z, it is used to represent the state of the atmosphere for a greater period of time, e.g., from 09Z through to 15Z. • The Pilot (or user) must perform a "mental interpolation” to comprehend the atmospheric state during the intervals.
Atmospheric HazardsScenario 1 - Turbulence The figure above shows CAT objects created from the Unified Model – Global Field - for one instance in time (T+06 hours) for three flight levels: FL300 = Red, FL340 = Yellow and FL385 = Blue. (NB The format of this image is for illustration only.)
Atmospheric HazardsScenario 1 - Turbulence It is foreseen within FLYSAFE that (by 2020) the capability to uplink on demand, ½ hourly forecasts for the next two hours showing the distribution and evolution of CAT. This would provide flight crews with an increased awareness of • Forecast CAT areas, • Evolution in time, space and severity thereby allowing them time to decide upon their course of action. T+30 minutes T+60 minutes The figures on the right illustrate CAT Forecasts for one flight level (FL340) over a short period of time. (NB The format of this image is for illustration only.) Red – severe, Yellow – moderate, Blue – light T+90 minutes
Atmospheric Hazards The first scenario was based upon a real incident and we have illustrated how FLYSAFE’s vision could have mitigated the situation – unplanned change in vertical separation. We now consider a second scenario in which • the atmospheric hazard is icing • we imagine that FLYSAFE’s vision is operating fully • illustrate how vertical and horizontal separations could be affected
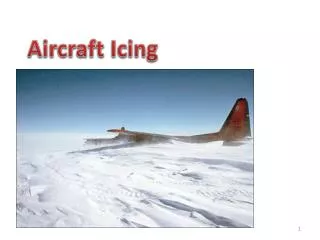
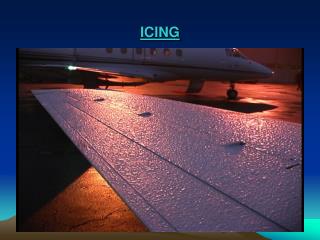
Atmospheric HazardsScenario 2 - Icing It is recognised that ice-accretion is and remains a significant threat to the safe conduct of a flight. An aircraft may encounter regions of super-cooled liquid water in the atmosphere. The effects of such particulates can: • cause a build-up of ice across surfaces as water droplets freeze on contact with the aircraft’s leading edge surfaces; this includes accretion at the ice-edge; • create aircraft specific severity: due to aerofoil section and size even small amounts of ice can have a severe effect on aerodynamic flow due to relative roughness; • reduce maximum lift capacity: a lower lift coefficient for each angle of attack, an earlier stall angle-of-attack and increased drag forces; • cause ALL engines to “flame out.” In any operational flight involving icing conditions, the factors noted above change continuously.
Atmospheric HazardsScenario 2 - Icing The severity on aircraft performance depends upon its class, time spent within the icing conditions and available counter measures: • Transport Jet Aircraft – during take-off and landing: effects of ice on aerodynamic performance: increased weight, increased drag, reduced lift capacity and thus increased stall speed; avoidance measures whilst on the ground are to de-ice or delay departure. • Turbo-prop – whilst en-route, increase drag due to ice accretion on propeller blades, reduced thrust due to reduced lift capacity and maximum engine power limits reached; possibility for all engine flame outs; avoidance measures is to change flight level or return to clear air. • Business Jet – aircraft are more sensitive to icing; disrupted aerodynamic flow is scale dependent; avoidance measure is to change flight level. Clearly, avoiding situations that would cause sudden (unplanned) changes in separation is desirable, especially when flight crew undertake actions to recover aircraft stability.
Atmospheric HazardsScenario 2 - Icing The most vulnerable class of aircraft are propeller driven. • A turbo-prop aircraft, • en-route at night-time, operating its engines at maximum power. • unbeknown to the flight crew, ice accretion has created drag forces which reduces the aircraft’s forward speed leading to a progressive reduction in the horizontal separation; • ice-protection equipment activates too late and cannot remove ice accretion totally; • crew need to perform an unplanned rapid descent to recover control; • descent becomes a dangerous option due to underlying terrain. • Mitigation of this event How would systems being developed in FLYSAFE mitigate this event? (There are other factors, e.g., human factors, all engines flame-outs, failures of sensors & detectors to detect ice, equipment malfunction to remove ice, mechanical responses of aerofoil.)
Atmospheric HazardsScenario 2 - Icing Super-cooled Liquid Water Content (Ice) Forecasts Forecast region of super-cooled liquid water as represented by forecast model. (NB The format of this image is for illustration only.) In this simple illustration, the flight crew can plan ahead of time changes to the flight’s trajectory that may affect separation: a pilot may decide to fly above or beneath the hazardous sector or avoid the region completely.
FL140 FL100 FL065 Atmospheric HazardsScenario 2 - Icing • A turboprop aircraft departs Lyon (LFLL) for arrival at Montpellier (LFMT). En-route it encounters severe icing at FL100 near Montelimar (LFLQ). The pilot activates anti-icing and climbs to FL140 but encounters an even more critical situation - rapid ice accretion that causes one engine to stop. Pilot descends to below FL065, the ice melts and the engine re-starts again by itself. • Noted below are the forecast ice regions: (NB The format of this image is for illustration only.) Montelimar Lyon Montpellier Red – severe icing Orange – moderate icing Yellow – light icing
Summary • We have considered two scenarios in which aircraft separation changes unexpectedly: • Vertically – due to clear air turbulence • Horizontally & Vertically – due to in-flight icing • We have explored how FLYSAFE’s vision of greater situation awareness could mitigate these events by: • up-linking more frequently, data indicating the spatial extent, evolution and intensity of areas of adverse atmospheric conditions • customising the requests for data to the intended flight path of each aircraft • providing forecasts of the state of the atmosphere, flight crew would have sufficient time to plan their actions thus reducing unexpected changes in vertical/horizontal separations
Contact Details For further information please contact: Andrew Mirza Met Office andrew.mirza@metoffice.gov.uk Aviation Applications Meteorology Research & Development Met Office, FitzRoy Road, Exeter, Devon, EX1 3PB, United Kingdom Please visit our website: http://www.eu-flysafe.org
Acknowledgements Bob Lunnon, Lauren Ried Met Office, UK Patrick Josse, Agathe Drouin Meteo France Thomas Gerz, Arnold Tafferner DLR, Germany Wilfred Rowhurst, Adri Marsman NLR, Netherlands Wim Huson Use2Aces, Netherlands Bibliography, • Lecture Notes, “Effects of Aircraft Icing,” Wim Huson, Use2Aces • Lecture Notes, “Effects of Aircraft Icing”, ENAC, Meteo France • “The Adverse Aerodynamic Effects of In-flight Icing on Airplane Operations”, J C T Martin, Aviation Safety Letter, Transport Canada, Issue 1, 2007 • NLR-ATSI Air Transport Safety Database • AAIB Bulletin No 2/2002, 6/2201, Air Accidents Investigation Branch, Department for Transport, UK
List of abbreviations CAT Clear Air Turbulence CWP Central Weather Processor, part of the GWP which contains weather information for En-route GML Geospatial (Geography) Mark-up Language, an implementation of XML (eXtensible Mark-up Language) used to encode webpages GML Object Field data converted to text which is encoded using GML GWP Ground-based Weather Processor Architecture, which comprises a network of LWPs, a CWP and an access interface LWP Local Weather Processor, part of the GWP which contains weather information for the TMA WIMS Weather Information Management System, a dedicated system used to forecast a specific atmospheric hazard, e.g., Icing, CAT