Download
1 / 4
40 likes | 164 Views
Fig. 1. Antibody response in mice immunized with VLP.

E N D
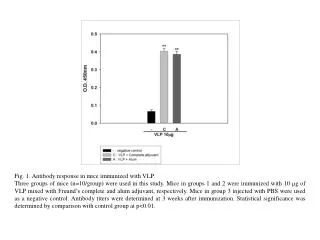
Fig. 1. Antibody response in mice immunized with VLP. Three groups of mice (n=10/group) were used in this study. Mice in groups 1 and 2 were immunized with 10 mg of VLP mixed with Freund’s complete and alum adjuvant, respectively. Mice in group 3 injected with PBS were used as a negative control. Antibody titers were determined at 3 weeks after immunization. Statistical significance was determined by comparison with control group at p<0.01.
(B) (A) Fig. 2. Cytokine production in mice immunized with VLP. The amounts of (A) IFN-g and (B) IL-10 were determined in supernatants of splenocytes. Splenocytes were isolated from negative control mice and mice immunized with VLP mixed with Freund’s complete or Alum adjuvant at 3 weeks after immunization. They were stimulated with (+) or without (-)VLP for 3 days. Cell culture supernatants were collected every day and cytokine amounts were determined with commercial ELISA kits. Statistical significance was determined by comparison with control group at p<0.05 and p<0.01.
Table 1. Neutralizing antibody titers to PRRSV *Neutralizing antibody titers were determined with serum samples of mice that were immunized with 10 mg of VLP mixed with Freund’s complete or Alum adjuvant. Serum samples of negative control mice were also examined at the same conditions.
Table 2. Cell viability after 3 days culture Group Stimulation with VLP* Viability (%)** Control O 86 X 88 VLP with Freund’s O 84 X 84 VLP with Alum O 87 X 86 Mean 86 *Splenocytes obtained from mice immunized with VLP or control mice were cultured for 3 days with or without VLP stimulation. **Cell viability was determined with an automatic cell counter.