Download

1 / 9
90 likes | 189 Views
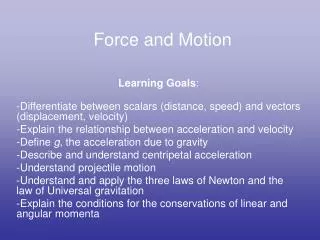
Thursday, September 19 Force and motion. Mrs. Hensley Sedgefield Middle School. Do Now!. In your scientific journal,. Interpreting Graphs: Let’s start with vocabulary. Write down the verbs in the box below and make a key as follows: peak soar rise fluctuate decline drop

E N D
Thursday, September 19Force and motion Mrs. Hensley Sedgefield Middle School
Do Now! • In your scientific journal,
Interpreting Graphs: Let’s start with vocabulary. • Write down the verbs in the box below and make a key as follows: • peak soar • rise fluctuate • decline drop • climb increase • stabilize
Do this in your scientific journal • Circle verbs that mean to go up • Underline the verbs that mean to go down • Put a star next to the verb that means to go up and down • Use and arrow to indicate the word that means to reach its highest level • Put a triangle next to the word that means to stay the same for a period of time
Write the following graph questions • 1. In the year 1990, tadpole populations began to _______________ • rapidly. • 2. Tadpole populations reached a _________________ in 1992. • 3. Between 1992 and 1993, populations of tadpoles______________.
Write the following graph questions • 4. Tadpole populations ________________after 1993 • 5. Between 1995 and 1999, populations______________________. • 6. How many tadpoles were in the pond at its peak? (answer in a complete sentence)
Write the following graph questions • 7. How many tadpoles were present in the pond in 1998? (answer in a complete sentence) • 8. Between 1990 and 19993 populations______________________. • 9. Between 1998 and 1999, tadpole populations___________________ somewhat.
Exit ticket – in your journal • Name one positive thing and one negative thing that happened during group work today.