Engaging with Shape: Unleashing Stories from Data through Statistical Investigation
Dive into the world of statistical investigation to uncover meanings from observed phenomena, inform decisions, and expand contextual knowledge. This workshop explores multivariate statistics, data storytelling, and practical applications for educators focusing on junior statistics. Learn to craft investigative questions, analyze distributions, and engage students effectively with data shapes.

Engaging with Shape: Unleashing Stories from Data through Statistical Investigation
E N D
Presentation Transcript
“Statistical investigation is part of information gathering and learning process with is undertaken to seek meaning from and to learn more about observed phenomena as well as to inform decisions and actions. The ultimate goal of statistical investigation is to learn more about a real world situation and to expand the body of contextual knowledge” Multivariate Statistics Telling stories from data
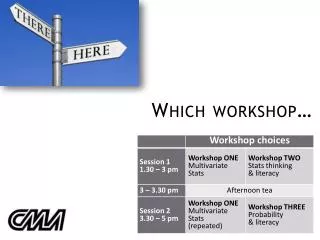
Introduction • Grant Ritchie and Dr Michelle Dalrymple • Cashmere High School • Housekeeping (loos, afternoon tea, emergencies) • Junior Statistics focus • Collated information from variety of resources • Plan for this session…
Data cards – what are the variables? KAREKARE COLLEGE: DATA CARD VARIABLES • What would the survey questions have been? • How was each variable measured? (units?) • Possible outcomes for each variable? • What type of data is this? • Who would use this data? • Introduce your student…
C@S lesson plans… • http://new.censusatschool.org.nz/resources/level-5/
CHS Emphasis Year 9 Year 10 Theoretical Probability & Literacy PPDAC Statistics (Making the call) • Introducing PPDAC – through Probability • Statistical Literacy
KareKare College KAREKARE COLLEGE: DATA CARD VARIABLES Sort your data
Samples give us an idea about what is happening in the population
Investigative questions • Summary • Comparison • Relationship • Other
What makes a good question? • Can be answered with the data • Population of interest is clear • Group(s) of interest is clear • Variable(s) of interest is clear • Intent (summary, comparison, relationship) is clear • Someone is interested in the answer
Investigative question…. • I wonder if heights of boys at KareKare College tend to be greater than heights of girls at KareKare College? • CHECK • Variable • Groups • Population • Direction of comparison
Two small asides… Shape Writing analysis statements
Sketching shapes Quickly sketch the general shape of the distribution
Reflection: Seeing shape • What did you look for when catching a glimpse of the plot? • Are your plots similar to your neighbours? • What is important to emphasise with your students?
Describing shape • Choose one plot and with your neighbour discuss how your Year 10 students would describe the shape • What sort of language would they use?
Giving students statistical language for shapes Normal (Bell-curved) Symmetric Uniform Unimodal Bimodal Trimodal Skew Right, Positively Skewed, Long Upper Tail Skew Left, Negatively Skewed, Long Lower Tail Outliers, Extreme Values
Engaging with shape • One of the keys for unlocking the story behind the data • Develops the skill of what to look at and what to look for • Using their imagination, they start to notice what is interesting, unusual or unexpected. What are the data trying to tell us?
KareKare college • Sketch what you expect the distribution of heights for girls and boys to look like? • Put a scale along the bottom of your sketch
Describing distributions • We need to help students write good ANALYSIS comments every time we ask them to write. • Model for them • Give structures for them to use
Sensible order to structure our analysis comments… • Centre • Spread • Shift & overlap • Shape
Writing structures • I notice… • I wonder…
Writing structuresPEER • Used to craft each statement
Writing structuresOSEM • O stands for Obvious observations: • Write down one thing you notice, then leave a gap, and write down something else you notice. Try to get 3 obvious things. • S is for Specific: • Under each obvious observation, explain what you mean so that another person would get it. • E is for Evidence: • Support each observation with numbers or calculations. • M is for Meaning: • So what? Write down what each of your points tells you about the original problem/situation. What else could we find out?
KareKare college • I wonder if heights of boys at KareKare College tend to be greater than heights of girls at KareKare College? • Take a random sample of 30 boys and 30 girls • Dot plot box plot…
This is a random sample of students from KareKare College • Write some analysis descriptions
To make the call back in the population Teaching world…