Download
1 / 22
220 likes | 361 Views
The Observed Response of the Lower Thermosphere to Solar Energetic Inputs. Scott M. Bailey, Erica M. Rodgers, Justin Yonker Geophysical Institute University of Alaska Charles A. Barth, Daniel N. Baker Laboratory for Atmospheric and Space Physics University of Colorado

E N D
The Observed Response of the Lower Thermosphere to Solar Energetic Inputs Scott M. Bailey, Erica M. Rodgers, Justin Yonker Geophysical Institute University of Alaska Charles A. Barth, Daniel N. Baker Laboratory for Atmospheric and Space Physics University of Colorado scott.bailey@gi.alaska.edu
Abstract The production of nitric oxide is a key response of the upper atmosphere to solar energy deposition. NO plays a strong role in the thermospheric energy balance as it emits efficiently in the infrared, it is the terminal ion in the lower ionosphere, and if transported to lower altitudes will catalytically destroy ozone. NO is primarily produced through the reaction of excited atomic nitrogen with molecular oxygen. One of the primary loss mechanisms of NO is photo-dissociation by solar ultraviolet irradiance. In order to produce the excited atomic nitrogen atom, the strong N2 molecular bond must be broken. At low latitudes, solar soft X-ray irradiance is the energy source that leads to NO. At high latitudes, auroral electrons and the energetic secondary electrons provide the source of energy that leads to the large amounts of NO observed there. Coupling between latitude regions may occur as high latitude NO is transported by winds to lower latitude. In this talk we describe observations of NO from the Student Nitric Oxide Explorer (SNOE). SNOE obtained global observations of lower thermospheric NO from February 1998 through December 2003. We will present case studies of the observed response to large auroral storms. The SNOE observations show that auroral energy deposition produces a significant global effect on the upper atmosphere.
Nitric Oxide — Why it is important? Present in the thermosphere - maximum density near 110 km: • Abundance — several times 10-4 mixing ratio at 130 km • Highly variable — factor of ten — 27 day and 11 year variation • Always larger in the auroral region (max at 65° geomagnetic latitude) Present in the mesosphere - minimum density near 75 km: • Abundance — several times 10-9 mixing ratio at 70 km • Transport downward from the lower thermosphere into the mesosphere — Particularly during the winter polar night Odd nitrogen reacts with odd oxygen: NO + O3 NO2 + O2 NO2 + O NO + O2 Odd nitrogen controls the composition of the lower Ionosphere: NO + O2+ NO+ + O2 N + O2+ NO+ + O NO+ + e N + O Nitric Oxide is the most important cooling mechanism in the lower thermosphere: • Heteronuclear molecule has a permanent electric dipole moment — Infrared cooling in the 5.33 mm band — Controls temperature in the critical 120 km region
Production of Nitric Oxide NO is primarily created through the reaction of excited atomic nitrogen with molecular oxygen: N(2D) + O2 → NO + O A major source of excited atomic nitrogen is produced through energetic electron impact with molecular nitrogen: e* + N2 → N(2D) + N + e* Destruction of Nitric Oxide NO is primarily destroyed through the reaction with ground state atomic nitrogen: NO + N(4S) → N2 + O NO is also destroyed through photodissociation: NO + hn → N(4S) + O Note that this reaction is doubly effective since it creates a ground state N atom which can also destroy NO. The effective lifetime of an NO molecule is about 1 day under sunlit conditions.
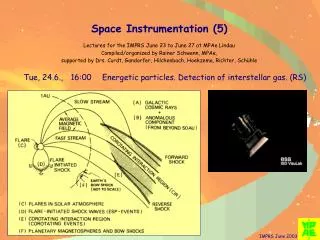
So where do the energetic electrons come from? Two sources: • Photoelectrons – solar soft X-ray irradiance, l < 10 nm • Precipitating auroral electrons
SNOE obtains global observations of nitric oxide Polar Orbit – constant local time near 11AM/PM 15 orbits per day - observations are obtained at all latitudes and 15 longitudes (same local time) each day Spinning satellite – altitude profiles from 0 to 200 km, NO densities are obtained from 95 to 150 km SNOE UVS observes 215, 237 nm fluorescently scattered solar radiance – NO is only measured at locations which are illuminated by the sun.
SNOE observations show that NO responds to varying solar activity as expected. High latitude profiles sorted by AP Low latitude profiles sorted by F10.7 Note that larger concentrations of NO are observed at the high latitudes.
SNOE observations show significantly larger amounts of NO at high latitudes.
Even if data for days of low auroral activity are considered, SNOE observations show larger amounts of NO at high latitudes.
A one-dimensional chemical model reproduces observed equatorial altitude profiles Model Incorporates: • Solar soft X-ray irradiance, l < 20 nm, measured by SNOE • Relevant photochemistry, 35 reactions • Vertical diffusion • MSIS neutral atmosphere, GLOW energetic electron transport code
The chemical model reproduces observed equatorial NO densities for 935 days SNOE Observations Model Predictions
Northern Winter Southern Summer Solstice Northern Winter Southern Summer Solstice SNOE observations for 935 days show large amounts of NO near polar regions and sporadic enhancements at all latitudes. Geographic Latitude
Northern Winter Southern Summer Solstice Northern Winter Southern Summer Solstice The photochemical model can be used to calculate the global distribution of NO produced by solar soft x-rays. Geographic Latitude
Geographic Latitude Geographic Latitude
Northern Winter Southern Summer Solstice Northern Winter Southern Summer Solstice By subtracting the calculated NO produced by solar soft x-rays from the observations, we determine the global distribution of NO produced by auroral energy. Geographic Latitude Note that the auroral energy routinely reaches middle latitudes and occasionally reaches the equator. This excursion to lower latitudes must be caused by winds. NO transported to lower latitudes will lead to enhanced cooling as well as modification of the temperature structure and D/E region composition there.
Northern Winter Southern Summer Solstice Northern Winter Southern Summer Solstice Smoothing by 30 days reveals a repeatable pattern of winter transport of NO to middle latitudes. Geographic Latitude Note that in summer times, there is negligible NO produced by auroral energy.
The photochemical model can be iterated with varying auroral inputs to obtain the auroral energy deposition required to reproduce the NO observations. North Northern Winter Southern Summer Solstice Northern Winter Southern Summer Solstice Day of Year The resulting energy fluxes show strong seasonal dependence with minima at the summer solstice.
North Day of Year South Day of Year
The ratio of hemispheric energy inputs shows that winter energy deposition is significantly larger than summer energy deposition. Northern Winter Southern Summer Solstice Northern Winter Southern Summer Solstice Day of Year The ratios may also be increasing with solar activity.
Conclusions: The production of NO by solar soft X-ray irradiance is well understood. NO produced by auroral energy is transported by winds to middle latitudes and sometimes to the equator. Auroral energy deposition varies strongly with season and is at a minimum at summer latitudes. This is consistent with previous studies which have shown that discrete auroral events are suppressed in the summer.