Cause & Effect Diagram
Cause & Effect Diagram. Cooper White, MD Jen Powell, QI Consultant. Cause & Effect Diagram. A graphic tool used when you need to identify and explore and display the possible causes of a specific problem or condition.

Cause & Effect Diagram
E N D
Presentation Transcript
Cause & Effect Diagram Cooper White, MD Jen Powell, QI Consultant
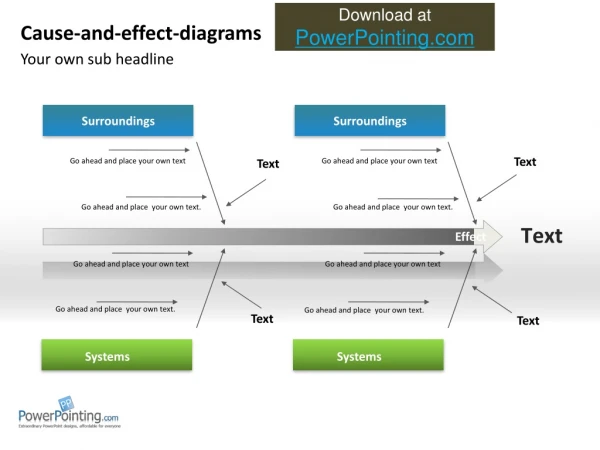
Cause & Effect Diagram • A graphic tool used when you need to identify and explore and display the possible causes of a specific problem or condition. • Developed to represent the relationship between some “effect and all the possible “causes” influencing it. • The effect or problem is stated on the right side of the chart and the major influences or ‘causes’ listed to the left • Causes might be summarized under the categories of Materials, Methods, Equipment, Environment, Leadership and People Source : IHI Process Analysis Tools, Cause and Effect Diagram, the Memory Jogger Plus, 1996, GOAL/QPC
Benefits to QI Teams A cause and effect has these benefits: • It helps teams understand that there are many causes that contribute to an effect • It graphically displays the relationship of the causes to the effect and to each other • It helps to identify areas for improvement Source: IHI Process Analysis Tools, Cause and Effect Diagram
Directions: Cause and Effect Diagram • Find on-line template @ http://www.isixsigma.com/tools-templates/cause-effect/cause-and-effect-aka-fishbone-diagram/ (word and excel formats) • Draw a diagram using the IHI Handout instructions, posted on the CQN website under QI Tools or on the IHI website @ http://www.ihi.org/search/pages/results.aspx?k=fishbone%20diagram