Download
1 / 37
370 likes | 405 Views
Learn about the advanced techniques like Wiener–Khinchine theorem for Doppler imaging and applications in medical diagnostics. Understand the advantages and limitations of Color Doppler Power Imaging. Discover how to improve accuracy and reduce aliasing in Doppler flow imaging using Pulse Repetition Frequency control.

E N D
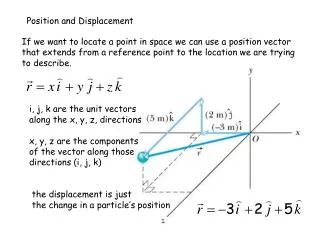
Flow and Displacement Imaging M. Atarod
Duplex Scanner • Ultrasonic B-mode real-time imaging can be combined with Doppler in a scanner to provide • anatomical information • blood flow data. • Both sets of information are displayed simultaneously. • An FFT algorithm is used to compute the Doppler spectrum that is displayed in real time. • Blood flow data can be displayed in real time and superimposed with the B-mode image (if the data acquisition rate and image processing algorithms are sufficiently fast).
COLOR DOPPLER FLOW IMAGING • Duplex scanners capable of displaying B-mode and Doppler blood flow data simultaneously in real time • The Doppler information is encoded in color: • red indicate flow toward the transducer • blue indicate flow away from the transducer. • The magnitude of the velocity is represented by different shades of the color. • the lighter the color, the higher the velocity. • The color Doppler image is superimposed on the gray-scale B-mode image.
COLOR DOPPLER FLOW IMAGING vs. PULSED DOPPLER • The basic concept are similar • (extraction the mean Doppler shift frequency from a sample volume) • The only exception is that • the color Doppler instruments are capable of estimating the mean Doppler shifts of many sample volumes along a scan line in a very short period of time(30to 50 ms).
Wiener–Khinchine theorem • The autocorrelation function H(ז) of a function f(t) is the Fourier transform of the power spectrum P(ω) of f(t).
where the magnitude and phase of H are an even function and an odd function, respectively. The symbol A is used to represent the magnitude of H.
This expression says that: the mean frequency of a spectrum is equal to the slope of the phase of the autocorrelation function at the origin.
This expression indicates that the variance of the frequency can be estimated from the magnitude of the autocorrelation function at the origin and at T.
A hard-wired autocorrelator for estimating the antocorrelation function H(T) from a time signal f(t).
Autocorrelation method • f(t): real-time function • g(t): quadrature component f(t)(can be found by shifting the time function by 90°) • z(t) = f(t) + jg(t): complex function • The complex multiplier performs the operation:
Autocorrelation method • The autocorrelation function is obtained by integrating the output of the complex multiplier over a period of time, nT, where n represents the successive pulses transmitted by a scanner to acquire the autocorrelation function. • H(T) is time dependent. • The accuracy of the estimated H(T) is determined by the time duration in which the estimation is performed.
Example • The color Doppler scanners had 50 scan lines with a frame rate of 15 per second. • The dwelling time of the ultrasound beam at any one direction is: • If the depth of view is 10 cm, time of flight is 0.13 ms • The number of ultrasound pulses can be transmitted in this time span :1.33/0.13 = 10 therefore: the autocorrelation function is computed and averaged after ten pulse transmissions.
The autocorrelator needs to compute the autocorrelation function for each pixel along a scan line.
Pulse Repetition Frequency • higher PRF is favored for • avoiding aliasing • increasing the accuracy of the autocorrelation • PRF limited by the • frame rate • field of view • in most color Doppler systems 8 kHz < PRF<16 kHz • Aliasing frequently occurs with color Doppler in cardiac imaging. To overcome these problems can • reduce the image size • use M-mode color Doppler
Tissue Doppler can be achieved by thresholding the Doppler signals so as to suppress the Doppler signal from blood and retain only the Doppler signals from tissues.
Clinical Applications • Diagnosing tiny shunts in the heart wall and valvular regurgitation and stenosis. • It considerably reduces the examination time in diseases associated with flow disturbance. • Problematic regions can be quickly identified first from the flow mapping.
Shortcoming • Flow perpendicular to the beam cannot be reliably detected. • Higher blood flow velocity results in aliasing. • Its spatial resolution is poorer than B-mode gray-scale imaging. • The mean velocity estimated is the average velocity within a pixel or voxel. • overlaiding color Doppler image over the gray-scale B-mode is determined arbitrarily by thresholding, which may result in vessel wall overwrite obscuring the slow blood flow signal near the wall. • Large echoes due to slow moving tissues can cause the “color flash artifact” because they overlap echoes from flowing blood.
COLOR DOPPLER POWER IMAGING • The power contained in the Doppler signal is displayed. • several advantages: • A threshold can be set to minimize the effect of noise. • The data can be averaged to achieve a better signal-to-noise ratio. • The images are less dependent upon the Doppler angle. • Aliasing is no longer a problem because only the power is detected. (signals from blood flowing in much smaller vessels can be detected, similar to that of x-ray angiography)
COLOR DOPPLER POWER IMAGING Disadvantages: • it is more susceptible to motion artifacts because of • frame averaging • the image contains no information on flow velocity and direction
Color Doppler power image of carotid artery acquired with a 12-MHz linear array. The presence of a color in a pixel merely means that a flow signal is detected in that pixel.
COLOR DOPPLER POWER IMAGING • Power Doppler imaging is easier to implement than conventional color Doppler because Doppler “power” is readily available in conventional color Doppler • H(0) is the power contained in the Doppler spectrum.
TIME-DOMAIN FLOW ESTIMATION • Blood flow velocity has been estimated directly from: • B-mode images (Frame-to-frame speckle tracking) • Radio frequency (RF) echoes (direct correlation of echoes)
Cross-correlation can be used to estimate blood flow in time domain.(if the distance, d, that the blood has moved within one PRP can be measured, the velocity, V, would be given by V = d/PRP.)
Flow estimation (cross-correlation) • A segment of the waveform or the windowed e1(t) is cross-correlated with all segments of similar width of waveform e2 (t) by computing the one-dimensional normalized cross-correlation coefficient, ρ • A match is found when ρ is maximal.
Flow estimation (cross-correlation) • Maximal ρ occurs when the windowed waveform of e2 (t) is shifted Δt from the windowed segment of e1 (t) • The volume of blood responsible for the windowed e1(t) has moved a distance d = c Δ t/2 • Blood flow velocity can be estimated from:
Time domain methods vs. Doppler methods • Time domain methods differ from Doppler methods in that they track displacements. • They have several advantages over Doppler methods. Time domain methods: • can be used when there is no motion, but Doppler cannot. • are more immune to noise. They can be used in a noisier environment and need less averaging, yielding a higher frame rate. • There is no aliasing problem. The search will yield no results if the pulse repetition frequency is not sufficiently high. • The spatial resolution attainable with these methods is higher than Doppler methods because short pulses are used. • Two-dimensional flow information can be obtained by matching two dimensional blocks by computing two-dimensional correlation coefficients.
Frame-to-frame speckle tracking • Speckle tracking is more desirable in that the flow information can be directly obtained from the B-mode images without additional hardware. • Poorer spatial resolution than RF correlation. • this problem may be overcome by injecting a contrast agent • the signal level from blood in the frequency range of 3 to 10 MHz is too weak to obtain a reliable estimation and the frame rate of 30 frames per second is too low to estimate arterial blood flow velocity. • a high frame scanner must be used to solve the this problem.
ELASTOGRAPHY • a flat plate compress the tissue by a distance Δz. • Elastography may be capable of imaging elastic property of tissues, which cannot be achieved with standard B-mode sonography. • The stress propagating into a tissue will be attenuated by tissues, spread into other directions from the primary incident direction, and interact with a boundary between two media of different elastic properties.
Sonoeleasticity Imaging • Is a dynamic approach • The source typically vibrates at a frequency of a few hundred hertz to a few kilohertz • A conventional Doppler device can be used to monitor the motion with little modification. • Has been used to assess prostate cancer. • Imaging suffers from similar problems mentioned previously. • The vibration produced by the source is nonuniform and is attenuated by tissues.
B-mode blood flow (B-FLOW )IMAGING Is a new method • that improves the resolution, frame rate, and dynamic range of B-mode • image blood flow and tissue simultaneously • Combines the coded excitation imaging with a scheme to equalize tissue signals, which is necessary because tissue echoes are often much higher than those from blood. • The gray scale of an echo is adjusted by correlating the echo waveforms temporally. • The correlation function measures the similarity of two echo waveforms and is determined by • blood echogenicity • blood flow velocity • and beam width. • A filter is designed to suppress large and slow or nonmoving echoes.