Download
1 / 28
310 likes | 520 Views
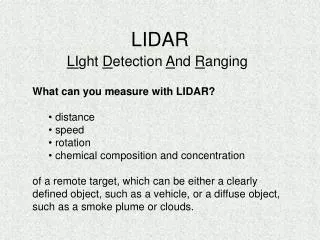
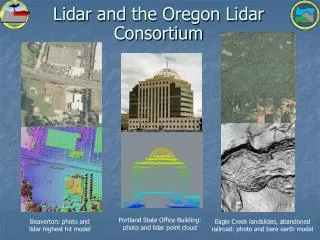
Lidar and the Oregon Lidar Consortium. Portland State Office Building: photo and lidar point cloud. Beaverton: photo and lidar highest hit model. Eagle Creek landslides, abandoned railroad: photo and bare earth model.

E N D
Lidar and the Oregon Lidar Consortium Portland State Office Building: photo and lidar point cloud Beaverton: photo and lidar highest hit model Eagle Creek landslides, abandoned railroad: photo and bare earth model
What is lidar (light detection and ranging)?- Simply making lots of accurate distance measurements with a laser rangefinder. Accurate laser rangefinders are commonly used as surveying instruments, measuring tapes, rifle scopes, even golf aids! Distance is calculated by measuring the time that a laser pulse takes to travel to and from an object.
Millions of very precise laser range measurements are made from a precisely located aircraft, producing an accurate and detailed 3-D map of the earth’s surface, as a “point cloud.” On-ground RTK-GPS base stations broadcast corrections to airborne GPS unit, locating the aircraft with an accuracy of a few centimeters. Aircraft attitude is precisely measured by Inertial Motion Unit, so that the exact position and orientation of the laser rangefinder is always known. The rangefinder scans across the surface at 100,000 to 200,000 pulses per second, collecting millions or billions of precise distance measurements, which are converted to 3-D coordinates.
Point cloud data define the 3-D shape and location of the land, vegetation, and structures. The complete collection of measured points for an area is called the point cloud, which is the fundamental form of lidar data. It provides a very detailed and accurate 3-D map of ground surface, vegetation, and structures. (above) Animated point cloud image of the Portland LDS Temple; points are colored by their relative height: red highest, blue lowest. (right) Photo of the same building; note statue on left hand spire, visible in both images.
Each laser pulse can produce multiple consecutive measurements from reflections off several surfaces in its path. This provides detailed images of vegetation structure and density, and returns data from the ground under tree cover. • red= 1st return • yellow = 2nd return • green = 3rd return Image on the left is a point cloud lidar view of the tree in the photo on the right. Each point is colored by which return it was from a particular pulse:
OLC data are collected at very high pulse density, producing very detailed images. Point cloud image on left compared to orthophoto on right shows actual point density of lidar data acquired over school bus lot. Each bus has been measured by 180-200 lidar points!
The lidar point cloud can even image livestock in the field! Red and yellow clusters of points above ground are cattle standing or lying in pasture.
For comparison, the best previously available ground model is shown on the left. The 10-m USGS Digital Elevation Model shows only a crude representation of the real surface. The lidar vendor uses a variety of software filters to choose the points out of the point cloud that measure the ground surface. In the image on the right, vegetation points are green and ground points yellow. Even in thick forest there are numerous ground points. Even if only one point in one hundred is a ground point, the huge number of points means that a smooth seamless ground model can be made. The image on the left is a bare earth digital elevation model, with 3 ft pixels, and reveals incredible detail of the terrain beneath the trees, including a hidden landslide. Very high point density means that even in heavily forested areas, it is still possible to get a large number of measurements of the ground. Left image is orthophoto of the Tualatin River, right image is lidar point cloud with red points high, blue points low.
Bare earth lidar can show features that you cannot even see on the ground. Perspective view of lidar (Dec. 2007) on left matches photograph (July 2008) on right. The lidar was flown before clear cut logging of the reddish-brown slope, yet clearly shows an old logging road that is barely visible in the photograph. Arrows connect matching locations.
Lidar intensity image with 1 ft pixels Lidar highest hit model with 3 ft pixels Additional standard lidar products include a “highest hit” or “first returns” model, which shows the tops of trees and buildings, and an intensity image, which is a form of infrared photograph. True color orthophoto with 0.5 ft pixels Transmissionlines Nursery stock Residence Quarry Auto
Lidar data allow a wide variety of information about forests to be measured with unprecedented accuracy and completeness. Tallest tree at 252 ft! • Locate and measure individual trees in forest • Estimate fuel loads, carbon content, timber volume • Tell conifer from deciduous • Identify damaged forest 150-250 ft forest 60-100 ft forest Image at right shows a simple analysis, subtracting the bare earth surface model from a first return (highest hit) surface model to produce a canopy height model. Low canopy is violet, high is red. The shapes of individual trees are apparent, and the tallest tree in the forest can be easily found and measured. 135-190 ft forest 100-125 ft forest Brushand grass 40-60 ft forest 50-80 ft forest
Building, 9,000 sq ft, 27 ft high Building, 4,900 sq ft, 11 ft high Residence, 2,300 sq ft, 12 ft high Building, 19,850 sq ft, 89 ft high Building, 16,750 sq ft, 79 ft high Light standards, 54 ft high Building, 20,100 sq ft, 155 ft high Parking structure, 79,400 sq ft, 3-20 ft high, sloped for drainage Powerline, 56 ft high Highway sign, 27 ft high Overpass, 23 ft high Comparing the highest hit or surface and bare earth surface provides a detailed and accurate model of building area and height
Roadcut not too steep Drainage ditch on uphill side Properly crowned for drainage The lidar image can show where existing maps are inaccurate or show where mapped roads do not exist or locate roads that are not on existing maps Because the bare earth model contains detailed information about the shape of the land surface, it is easy to construct a profile across a road to examine its construction and condition The highly detailed bare earth model allows for accurate location of roads and provides easy access to unprecedented levels of detail about slopes and shapesYellow lines are best current digital road map.
Comparing the lidar-derived streams with the current digital stream map shows that the current data are often wildly inaccurate Dark blue lines are best current digital stream map, light blue are lidar-derived. Crosses divide, mouth wildly off misses sinuous channel, climbs ridges cross divides GIS software can automatically find stream channels from lidar data Blue lines are streams generated by ArcGIS Stream channels are readily apparent on lidar bare earth images
Stream section shows distinct floodplain and channel A detailed elevation profile down the stream shows areas of steep or gentle grade, waterfalls and pools. Culverts at road crossing show up as upward blips on the profile. Section shows “v” shape of rapidly downcutting stream In addition to accurately locating streams, lidar easily produces accurate and detailed profiles and sectionsLight blue line is lidar derived stream location, dark blue are section lines.
What can you do with lidar? You can quickly, cheaply, and accurately…. • Find landslides, old cuts and grades • Measure and estimate fills and cuts • Find stream channels, measure gradients • Measure the size and height of buildings, bridges • Locate and measure every tree in the forest • Characterize land cover • Model floods, fire behavior • Locate power lines and powerpoles • Find archeological sites • Map wetlands and impervious surfaces • Define watersheds and viewsheds • Model insolation and shading • Map road center and sidelines • Find law enforcement targets • Map landforms and soils • Assess property remotely • Inventory carbon • Monitor quarries, find abandoned mines • Enhance any research that requires a detailed and accurate 2D or 3-D map
The Portland Lidar Consortium was the first large scale effort to collect lidar in Oregon. “Hood to Coast” survey In 2006, the USGS provided DOGAMI with $100k to complete the City of Portland. DOGAMI formed the Portland Lidar Consortium to develop funding partnerships to increase the area. In 2003, the USGS funded DOGAMI for a pilot lidar survey to look for earthquake faults. With the USGS funds to anchor the survey and ensure a large enough area for the lowest possible rate, Federal, State and local government agencies added on their areas of interest until the entire project had grown to over 2300 square miles and $1.1 M, with over 20 funding partners. This was followed in 2005 by another USGS-DOGAMI flight in the Portland Hills, a USGS survey of the Columbia River Floodplain, and a survey by Oregon City of its urban growth boundary.
The Oregon Lidar Consortium (OLC) originated in 2007 with a request by DOGAMI to the 2007 legislature for funds to acquire lidar over the inhabited parts of Western Oregon. • The legislature provided $1.5 M of the 4.5 M request and encouraged DOGAMI to seek funding partners to increase coverage • The relatively small amount of funding requires prioritization to areas with significant local contributions Blue hatch at left shows the original $4.5 M target based on the inhabited area of Western Oregon. Red hatch shows the area that could be covered by $1.5 M, magenta shows existing data.
DOGAMI Business Plan for the OLC • Collection areas should be large and contiguous • Collection areas initially anchored by significant contribution from local funding partner • OLC builds on anchor funding by finding additional partners • State funds used to knit together partner areas • State funds are spent on the inhabited areas of the state • Collection areas completely outside the inhabited areas are fine if fully partner funded • Data in public domain • Where possible, collection areas should include entire 6th field watersheds
DOGAMI selected a vendor to provide lidar to the consortium. A nationwide RFP led to the selection for Watershed Sciences Inc. of Corvallis, Oregon, as the lidar vendor for the consortium under Oregon Price Agreement 8865. Watershed Sciences
OLC lidar prices are a function of area. DOGAMI adds 10% to the vendor price for quality control and management.
Data Specifications 1m • Aggregate pulse density > 8/m2 • Laser spot size on ground 15-40 cm • Absolute accuracy of each point • 20 cm horizontal and vertical • 50% sidelap for complete double coverage 1m • Swath to swath consistency 15 cm (same point measured by adjacent swaths must have similar value) Point cloud image of field and building: red points are from one swath, blue from another.
DOGAMI provides three-way independent quality control for OLC data. OLC lidar image showing DOGAMI quality control points (red triangles) collected by RTK-GPS survey. • Compare accurately surveyed control points to the final lidar product to test absolute accuracy (+/- 20 cm). Colors indicate data from different swaths “Bird” anomalies produce spikes in bare earth model Compare adjacent points from overlapping swaths to test consistency (+/- 15 cm) GPS elevation = 50.40 m Lidar elevation = 50.38 m Error = 2 cm Inspect bare earth models for artifacts, processing errors Lidar production software is used to automatically compare locations for huge numbers of points from overlapping swaths. Swath to swath differences, measured on hundreds of thousands of points per swath, average about 3 cm in this example
OLC Data Products 3 ft pixel first return DEM ESRI format (quad tiles) 3 ft pixel bare earth DEM ESRI format (quad tiles) Point cloud, LAS format 1/100 quad tiles Report and metadata !! 1 ft pixel intensity images (1/4 quad tiles) Ground points in LAS format (1/100 quad tiles) Aircraft trajectories
Data Distribution Options Funding partners: Copies are provided on external hard drives as soon as DOGAMI completes QC. • NOAA LDART website (point cloud) • USGS CLICK website (point cloud) • USGS NED website (DEM) • GEO spatial data library website (DEM) • METRO (Portland area only) • PSLC (“Hood to Coast” area only) • DOGAMI website (planned) • DOGAMI publications on disk or drive (planned) Public:
The City of Philomath As of September 2008, 25 partners have added $2.7 million to the Oregon Legislature’s $1.5 million. The City of Turner http://www.lincolncity.org/Portals/29/logo2.gif
As of September 2008, the OLC has been successful in building partnerships for several lidar collections around the state.Current status at http://www.oregongeology.com/sub/projects/olc/default.htm
Future Plans • DOGAMI is seeking funds in future biennia to extend coverage to other parts of the state, as illustrated in the conceptual draft below.