Download

1 / 43
430 likes | 456 Views
Learn about the steps of the Scientific Method, including observation/research, problem/question, hypothesis formulation, experimentation, data collection and analysis, and conclusion. Explore a realistic example of applying the Scientific Method to investigate the effect of sugar on bread rise.

E N D
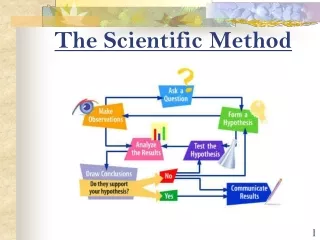
The Scientific Method involves a series of steps that are used to investigate a natural occurrence.
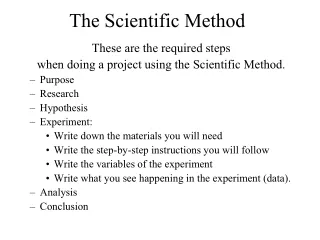
Scientific Method 1. Observation/Research 2. Problem/Question 3. Formulate a Hypothesis 4. Experiment 5. Collect and Analyze Results 6. Conclusion
Steps of the Scientific Method 1. Observation/Research: Make observations and research your topic of interest.
Steps of the Scientific Method 2. Problem/Question:Develop a question or problem that can be solved through experimentation.
Steps of the Scientific Method 3. Formulate a Hypothesis:Predict a possible answer to the problem or question. Example: If soil temperatures rise, then plant growth will increase.
Steps of the Scientific Method 4. Experiment:Develop and follow a procedure. Include a detailed materials list. The outcome must be measurable (quantifiable).
Steps of the Scientific Method 5. Collect and Analyze Results: Modify the procedure if needed. Confirm the results by retesting. Include tables, graphs, and photographs.
Steps of the Scientific Method 6.Conclusion: Include a statement that accepts or rejects the hypothesis. Make recommendations for further study and possible improvements to the procedure.
Let’s put our knowledge of the Scientific Method to a realistic example that includes some of the terms you’ll be needing to use and understand.
Problem/Question John watches his grandmother bake bread. He ask his grandmother what makes the bread rise. She explains that yeast releases a gas as it feeds on sugar.
Problem/Question John wonders if the amount of sugar used in the recipe will affect the size of the bread loaf?
Observation/Research John researches the areas of baking and fermentation and tries to come up with a way to test his question. He keeps all of his information on this topic in a journal.
John talks with his teacher and she gives him a Experimental Design Diagram to help him set up his investigation.
Formulate a Hypothesis After talking with his teacher and conducting further research, he comes up with a hypothesis. “If more sugar is added, then the bread will rise higher.”
Hypothesis The hypothesis is an educated guess about the relationship between the independent and dependent variables. Note: These variables will be defined in the next few slides.
Independent Variable The independent, or manipulated variable, is a factor that’s intentionally varied by the experimenter. John is going to use 25g., 50g., 100g., 250g., 500g. of sugar in his experiment.
Dependent Variable The dependent, or responding variable, is the factor that may change as a result of changes made in the independent variable. In this case, it would be the size of the loaf of bread.
Forming a hypothesis A friend notices that her dog is getting thinner even though she has not changed how much she feeds him. Propose 3 testable hypotheses to explain the dog’s weight loss.
Directions: Write a formal hypothesis for each of these statements Practice • Cold winters may affect the width of trees • Mascara use may lead to pink eye • Candy may cause cavities • Exercise is related to heart rate • Age may be related to risk of a heart attack
Experiment His teacher helps him come up with a procedureand list of needed materials. She discusses with John how to determine the control group.
Control Group In a scientific experiment, the control is the group that serves as the standard of comparison. The control group may be a “no treatment" or an “experimenter selected” group.
Control Group Because his grandmother always used 50g. of sugar in her recipe, John is going to use that amount in his control group.
Constants John’s teacher reminds him to keep all other factors the same so that any observed changes in the bread can be attributed to the variation in the amount of sugar.
Constants The constants in an experiment are all the factors that the experimenter attempts to keep the same.
Constants They might include: Other ingredients to the bread recipe, oven used, rise time, brand of ingredients, cooking time, type of pan used, air temperature and humidity where the bread was rising, oven temperature, age of the yeast…
Experiment John writes out his procedure for his experiment along with a materials list in his journal. He has both of these checked by his teacher where she checks for any safety concerns.
Trials Trials refer to repeat groups that are exposed to the same conditions in an experiment. John is going to test each sugar variable 3 times.
Collect and Analyze Results John comes up with a table he can use to record his data. John gets all his materials together and carries out his experiment.
Size of Baked Bread (LxWxH) cm3 Size of Bread Loaf (cm3) Trials Control group
Collect and Analyze Results John examines his data and notices that his control worked the best in this experiment, but not significantly better than 100g. of sugar.
Conclusion John rejects his hypothesis, but decides to re-test using sugar amounts between 50g. and 100g.
Experiment Once again, John gathers his materials and carries out his experiment. Here are the results.
Size of Baked Bread (LxWxH) cm3 Size of Bread Loaf (cm3) Trials Control group
Conclusion John finds that 70g. of sugar produces the largest loaf. His hypothesis is accepted.
The Controlled Experiment Control = a standard for comparison Variable = the factor being tested Hypothesis: If I apply more fertilizer, then the tomato plants will produce larger tomatoes. Independent Variable = can be changed or manipulated = fertilizer Dependent Variable = depends on independent variable = tomato size- will respond to experimental treatment
(Shrimp Example) • Observation • Those shrimp seem to be the same color as the algae they eat • Question • Is shrimp color related to the algae? • Hypothesis If algae pigments determine shrimp color then the color of shrimp will change if they eat different algae
Scientific Method Continued • Experiment to test prediction • Control shrimp eat usual algae, experimental shrimp are fed different algae • Results • Did the experimental shrimp develop different colors or not? • Conclusion • Food does/does not affect shrimp color
Reject or Accept Original Hypothesis • If accepted, you may form a theory and continue to test your theory • Theory: hypothesis that has been tested and supported by experimental data • Examples that you have heard before?
Theories Have Limits! Science has no “absolute” truth There is always a possibility that future research or evidence could cause a theory to be revised or thrown out.