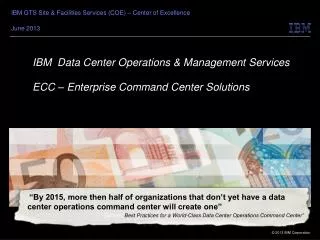
Enterprise Command Center Operations: Enhancing IT Services Management
Learn about the early days, missions, and strategy of the Enterprise Command Center (ECC) to proactively manage IT services, troubleshoot networks, and improve communication. Discover the tools and functions of the Network Operations Center (NOC) to effectively monitor and maintain network devices. Explore the use of Spectrum Auto Discovery for fault management and end user simulation for service monitoring. Enhance your understanding of how ECC optimizes IT service management processes.

Enterprise Command Center Operations: Enhancing IT Services Management
E N D
Presentation Transcript
Enterprise Command Center Presenter: Chris Rogers
Enterprise Command Center (ECC) Missions • Increase availability of IT services • Improve communication • Reduce mean time to repair • Reduce the number of problem calls
Clients • University of New Mexico • Information Technology Services • Communication and Network Services • The Albuquerque GigaPop • Pilot with the New Mexico State Government
ECC Strategy • Phase 1 - Get visibility into the environment • Phase 2 - Establish network troubleshooting and fault • Phase 3 - Establish application troubleshooting and fault • Phase 4 - Ticket responsible party alert all upstream departments to include functional departments • Phase 5 - Work on prediction technology • Phase 6 - Institute SLA matrix
Services • Fully functional Network Operations Center • Proactively provide end-to-end management of IT services. • Cross silo troubleshooting services
Network Operations Center (NOC)What we do (Phase 2) • Monitor 800 network devices supporting 35,000 end user nodes • Monitor 11 WAN sites and connections to Internet 2, LamdaRail, ESNet, and the commodity Internet
NOC FunctionsWhat we do it with • Traditional Network Fault Management • Spectrum from Computer Associates (Concord, Aprisma) • Trending and Analysis • eHealth from Computer Associates (Concord) • Arbor SP and Arbor X • End User Simulation • Automate • Application Response(AR) from Computer Associates (Concord)
NOC FunctionsWhat we do it with • Public Interfaces • PHP Weather Map • Joomla • Supplementary Programs • Groundworks (Nagios) • Sniffers from Network General and Ethereal
Where to Start • Auto Discovery • Modeling • Connectivity • Integration • Fault Identification – Root Cause • Event Suppression
Spectrum Auto Discovery Starts with a Seed Router Discovers all of the next hop Routers within a defined network range using IP routing tables
Spectrum Auto Discovery Along the way each Router is interrogated
Spectrum Auto Discovery Spectrum Model Physical characteristics Routing Switching Cards Interfaces Router Sub-Interfaces Functional characteristics T1 Card Routing T1 6/0 T1 7/0 T1 8/0 Switching VLANs SE6/0.1 SE8/0.1 SE6/0.2 SE8/0.1 SE8/0.1 Along the way each device is interrogated and a relational model is created with the routers physical characteristics, abilities interfaces, and even sub interfaces
Spectrum Auto Discovery Next Spectrum determines adjacency
Spectrum Auto Discovery Next Spectrum determines adjacency and an adjacency model is created at the port – sub/port level
Spectrum Auto Discovery VLAN101 VLAN102 This includes Identifying VLAN connections and redundant paths
Spectrum Auto Discovery VLAN101 VLAN102 This includes Identifying VLAN connections and redundant paths
Spectrum Auto Discovery This way correct connectivity can be established This continues to the switching and bridging layers
Network Fault Management Spectrum SNMP ICMP Spectrum Polls network devices like every other network poller. But once a fault is detected Spectrum begins interrogating the device and the devices adjacent to it to determine if it is a false alarm or to determine the root cause of the outage
Network Fault Management Spectrum Switch 1 ICMP ICMP ICMP ICMP ICMP SNMP Switch 2 Switch 3 Spectrum sends ICMP packets to the down stream devices with failure. Switch 4 Spectrum sends a ICMP packets to the upstream stream devices with success. Switch 5 Spectrum then interrogates the upstream device to determine a reason for not being able to reach the down switch in this case it is identified that the port on the upstream switch has been placed administratively down Spectrum creates a customizable alarm and places the downstream devices in an unreachable state to suppress any errors to them
Spectrum Ping Failure Switch 3 Ping Failure Switch 1 Ping Failure Switch 4 Ping Failure Switch 2 Ping Failure Switch 5 Traditional NMS Ping Failure Switch 3 Ping Failure Switch 1 Ping Failure Switch 4 Ping Failure Switch 2 Ping Failure Switch 5 Event Suppression • Alarms • Switch 1 Down • Alarms • Switch 3 Down • Switch 1 Down • Switch 4 Down • Switch 2 Down • Switch 5 Down
Network Fault Management Spectrum • In addition to root cause and event suppression • Spectrum handles • Maintenance periods • Customizable alarm management and filtering • Customizable per alarm and device scripting
Service Based Monitoring • What is important to the user • Test from a users perspective • If a service goes down and nobody notices did it really go down • If a service looks like it is down, although everything is working fine, ITS DOWN!!! • End user testing is problematic • Use a 2 out of 3 approach
Automated end user simulation The truest measure of an applications workability is whether the users whom use that application believe it is working normally. Therefore the end user perception of speed and availability are the Prime metrics to measure end user happiness quantitatively. These Prime metrics are the holly grail to determine if there really has been a performance or reliability impact or if the user is just complaining.
Automated end user simulation So the first question is how does the end user determine speed? In our case most of our applications are web based. So speed is determined by the responsiveness of the website to perform tasks. Therefore we decided to test the time it takes to perform a simple end user function using automation that simulates an end user.
Automated end user simulation We replace the end user with automation software which reacts to the application just an end user would.
Automated end user simulation Client 320 ms Network 44 ms Server 300 ms We then benchmark the response time of the test every 5 minutes By examining the network packets eHealths AR agent determines where the time in the response time is consumed. (Client, Network, Server) In troubleshooting this is our first line of defense in identifying the cause of a slowdown in performance. (Is it the Client, Network, or Servers)
Automated end user simulation Robot2 Client 320 ms Network 44 ms Server 30 ms We also perform this test from at least 3 different machines (robots). This absorbs any variance from normal end user random behaviors. Notice the network time for Robot2
Automated end user simulation Robot2 Network path between Robot 2 and Application Servers Look for a cause of the delay between Robot 2 and the Application Server
Spectrum eHealth Integration Spectrum integrates with eHealth to populate devices for discovery After being discovered in eHealth trending information is available by right clicking any discovered device
Spectrum eHealth Integration VLAN101 VLAN102 This includes trending information on the interface, sub-interface, and VLAN interfaces Additionally drilling into this graph creates further definition of the utilization on this link.
eHealth Trending This T1 link appears to be at 100%. It could be the cause of the delay in response time. OK, that is nice to know. The next question would be “Well what do we do about it”
eHealth and Arbor Do we Increase the bandwidth? To give us the data to answer these questions we need to find out what this utilization really is. Introducing Arbor. Arbor is a netflow based packet analyzer, which reports on who is doing what where.
Automated end user simulation Robot2 Netflow is collected from centralized routers Only traffic traversing through these points are seen
Arbor SP Who internally is using this traffic?
Arbor SP What is this traffic?
Arbor SP Which direction did it go from my router?
Arbor SP Which peer network did it use?
Arbor X • This graph shows the actual successful traffic traversing the T1
Automated end user simulation Robot2 In our case the traffic is a DOS Attack We blocked this port at our boundary router The response times for robot 2 returned to normal
Phase 3Migrating to a Service Based Monitoring Center • Separating the network from the application. • Moving end user simulation out of the network and closer to the application • Test the network using Cisco’s IP SLA (SAA) and test from every end device
Automated end user simulation With the addition of Spectrum we will stop using the robots to identify network problems. We are centralizing the robots and use them to report on application response time only.
Service Based Monitoring SAA Test SAA Test SAA Test SAA Test SAA Test SAA Test SAA Test We are using Cisco IP SLA (SAA) to test network delay. This will allow tests to be performed from every end of the network, not just the ones with robots.
Show Public ViewApp 1 Application Response Last Two Hours Network Response Per Building
Troubleshooting Network Response Time 54ns 50ns 50ns 2ns 54ns 2ns 34ns 29ns 2ns 33ns 30ns 32ns 33ns Weathermap
Cross Silo Troubleshooting • At UNM our technical teams are organized into functional silos. These silos become very specialized and detailed within their fields. • This specialization creates the problem of not becoming cross trained in other areas of expertise. • The ECC is purposely staffed by veterans who though knowledgeable in their respective areas are also “Jack of all trades” type people.
Cross Silo Troubleshooting Response Time Metric Bridge the gap Client Application Server Application Networking Windows Linux Storage Database Virtualization
Cross Silo Troubleshooting Response Time Metric Data
Future Services • Provide metrics and alerting of Service Level Management to our Information Assurance team. • Add VOIP as a new monitored application. • Additional Services
Reality Sets in • 2nd Level Support • 24x7x365 • No Resources—Banner Applications • Self Sustainability—Deeper level • Automation Balance