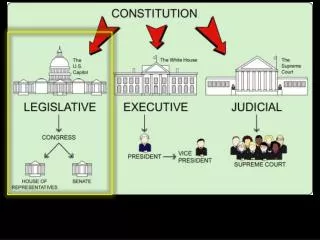
Democracy
Inequality and Environmental Protection James K. Boyce Department of Economics & Political Economy Research Institute University of Massachusetts, Amherst New Economics Summer Institute, Boston College, June 2012. Democracy. State. Market. Oligarchy.

Democracy
E N D
Presentation Transcript
Inequality and Environmental ProtectionJames K. BoyceDepartment of Economics & Political Economy Research InstituteUniversity of Massachusetts, AmherstNew Economics Summer Institute, Boston College, June 2012
Democracy State Market Oligarchy
BCA prescription: the “efficient” level of pollution $ MC MB Level of Environmental Degradation Neoclassical “optimal” level
BCA normative rule: maximize Net Present Value $ MC NPV MB Level of Environmental Degradation Neoclassical “optimal” level
Interpersonal aggregation in BCA NPV = net benefit = benefits minus costs summed over all individuals NPV = bi i where bi = net benefit to individual i
Let them eat pollution? The measurement of the costs of health-impairing pollution depends on the forgone earnings from increased morbidity and mortality. From this point of view a given amount of health-impairing pollution should be done in the country with the lowest cost, which will be the country with the lowest wages. I think the economic logic of dumping a load of toxic waste in the lowest-wage country is impeccable and we should face up to that. - Lawrence Summers, “Let them eat pollution,” The Economist, February 8, 1992.
Valuing human health risks The role of purchasing power Marginal benefits of reduction in poor countries “Efficient” level in poor countries
Beyond purchasing power: From normative prescription to positive description Decision power. Agenda power. Value power. Event power.
Event power: another example Siting of hazardous facilities in Louisiana’s “Cancer Alley” began before the Voting Rights Act of 1965.
Recall: BCA rule max bi i where bi = net benefit to the ith individual. If bi > 0, individual i is a winner; if bi < 0, individual i is a loser.
PWSDR max πi bi i where πi = power of the ith individual
BCA $ MC to losers = |Σbi| where bi < 0 i MB to winners = Σbj where bj > 0 j Neoclassical “optimal” level Level of Environmental Degradation
PWSDR: (i) winners more powerful than losers $ MC to losers = |Σbi| where bi < 0 i Power weighted MCto losers =|Σπibi| i Power weighted MB to winners = Σπjbj j MB to winners = Σbj where bj > 0 j Neoclassical optimum Actuallevel Level of Environmental Degradation
PWSDR: (ii) losers more powerful than winners Power weighted MC to losers = |Σπibi| $ i MC to losers = |Σbi| where bi < 0 i Power weighted MB to winners = Σπjbj j MB to winners = Σbj where bj > 0 j Neoclassical optimum Actual level Level of Environmental Degradation
Which is more widespread?(i) “too much” environmental degradation or (ii) “too little”? Benefits (in the forms of consumer surplus and producer surplus) are correlated with wealth: the rich consume more and own more stock. Even if costs were evenly distributed, net benefits (bi) are correlated with wealth. Power (πi) is correlated with wealth, too. Net benefits and power tend to be positively correlated. Cases where the winners are more powerful than the losers are more widespread.
PWSDR two hypotheses • Direction: Environmental costs will be imposed disproportionately on people with less power. 2.Magnitude: Greater power inequalities will lead to higher levels of environmental degradation.
Valuing human health risks The role of political power (πi) Power-weighted marginal benefits of reduction (poor countries) Actual level in poor countries
Valuing human health risks Purchasing power + political power combined Marginal benefits of reduction in poor countries Power-weighted MB of reduction (poor countries) Actual level in poor countries
PWSDR two hypotheses • Direction: Environmental costs will be imposed disproportionately on people with less power. 2.Magnitude:Greater power inequalities will lead to higher levels of environmental degradation.
Measuring interstate variations in power distribution Educational Attainment POWER DISTRIBUTION Voter Participation Medicaid Access Tax Fairness
Interstate variations in the distribution of power Environmental policy rank 7 5 49 46 RankState Score 1 Minnesota 2.32 2 Maine 1.65 49 Alabama -1.61 50 Mississippi -1.74 Source: Boyce, Klemer, Templet & Willis, “Power Distribution, the Environment, and Public Health,” Ecological Economics, 1998.
The new environmentalism:Beyond sacred groves and sacrifice zones For more, see The New Environmental Activists. Online at: http://www.peri.umass.edu/fileadmin/pdf/New_Environmental_activists.pdf.