Download
1 / 43
430 likes | 527 Views
Explore the methods and applications of Bayesian network in genetics research, including causal graphic networks, data integration, and target prioritization. Understand how genes interact and infer causal relationships in biological pathways. Learn about practical issues and the importance of genetic information in data integration for causal inference.

E N D
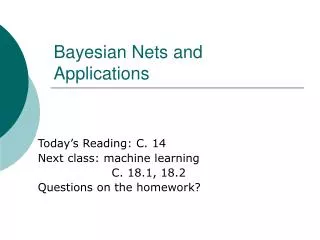
Bayesian network and its applications Jun Zhu Genetics Rosetta Inpharmatics Merck & Co.
Outline • Methods • Integration of genetics and gene expression • Integration of data from multiple tissues • Construction of causal graphic networks • Integration of transcription factor binding sites and protein-protein interaction (PPI) data • Applications • target selection and prioritization • Integrate with siRNA screening data • Integrate with proteomics data
Biological networks/pathways Data required to train models Association networks Probabilistic causal networks Mechanism based models Gene sets Biological details revealed
Biological networks/pathways Data required to train models Probabilistic causal networks Association networks Biological details revealed • How do genes in the same module interact? • How do genes in different modules interact? • Can we make causal inferences to elucidate signaling pathway for disease targets?
A framework for data integration Biocarta/Biopathway knowledge Medline Biologists High throughput data Microarray data How to integrate them? Database Proteomic data Genomics Hypothesis, test GUI Genetics
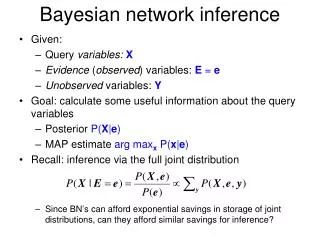
Bayesian network • decompose joint distribution based on conditional independence • Find maximum likelihood of G given data D, p(D|G)
Bayesian network • How it is reconstructed? • Local search method (insertion, deletion, reversion) • Complexity penalty (BIC score) • Bayesian average (1000 independent runs to explore possible space) Data is fixed Search the best model
Bayesian network-practical issues • How it is reconstructed? • NP-hard problem • Limit numbers of nodes • Limit search space
BN: Markov equivalent • Bayesian network is just a graphic model • Itself does not reveal causal information AB BA
Bayesian network: A, B and C are correlated, but through different mechanisms. A A C C B B L A A C B A C C B B
BN: priors of causal information • Break Markov equivalence by introducing priors for structures • Set priors so that p(AB) is different from p(BA) • Priors were derived from genetic information
Genetic map Genotype Gene expression of relevant tissues Clinical end points Integration of genetics and gene expression Experimental Design Experimental Data
Ingredients for inferring causality • Perturbations with a causal anchor • KOs/transgenics present a known perturbation (causal anchor) where response can be studied • Natural variation in a segregating population provides the same type of causal anchor (ability to identify DNA variations associated with response): DNA Supporting Gene X AACAGTT High expression, alt splicing, codon change, etc. Variation in DNA leads to variation in mRNA Variation in mRNA leads to variation in protein, which in turn can lead to disease Low expression, no alt. splicing, no codon change, etc. AACGGTT
L Distinguishing Causal from Reactive Genes Independent Causative Model Reactive Model Model eumelanin RNAs T1 ob/ob db/db A vy leptin obesity obesity leptin T2 T1 T1 L L T2 L T2 obesity L L: DNA ocus controlling RNA levels and/or clinical traits Quantitative trait 1 T1 R: Quantitative trait 2 C: T2 Schadt E, et al.,Nature Genetics, 2005
Inference causal relationships Gene A with cis acting QTL Genes with complex trans acting QTLs Gene A Physical location Gene A Gene C Gene B Chr 1 Locus 1 Gene expression of A and D correlate Locus 1 Chr2 Chr2 A and D have overlapping eQTL on Chr 1 at Locus 1 Locus 2 Locus 3 Gene expression of B, C & E correlate Gene D Chr 9 Gene E Gene D Physical location Gene A B, C and E have overlapping eQTL on Chr 2 Gene D Chr 1 Chr2 Locus 1 Locus 2 Locus 1 Locus 3 Gene A controls Gene D Genes B & C control Gene E
Bayesian network-integrating genetics • Experimental Hsd11b1 signature : mice treated with Hsd1 inhibitor • Prediction Hsd1 signatures based on BxD data • Correlation to Hsd1 • 10% of predicted signature overlap with experimental one • BN without genetics • 20% of predicted signature overlap with experimental one • BN with genetics • 52% of predicted signature overlap with experimental one Zhu J, et al, Cytogenet Genome Res. 2004
BN: Genetics information is critical when sample size is small Zhu J, et al, PLoS Comput Biol. 2007
A framework for data integration Biocarta/Biopathway knowledge Medline Biologists High throughput data Microarray data How to integrate them? Database Proteomic data Genomics Hypothesis, test GUI Genetics
Can we find overlapped information better? 4-clique 4-clique 3-clique 3-clique Clique community (partial clique)
Comparing protein-protein interactions with gene co-expression 0.51 0.50 0.29 0.19
Integrating transcription factor (TF) binding data and PPI • Introducing scale-free priors for TF and large PPI complex • Fixed prior for small PPI complex
Application to yeast cross The network integrated genetics, TF and PPI has better prediction power.
Mechanism for a QTL hot spot Red: TF Green: PPI Zhu J, et al. Nature Genetics, 2008
Applications • How to use networks to prioritize candidates? • How to use networks to identify causal genes in genome-wide association studies?
Driver potential Query gene Hypergeometric test
Validating connections in human cohorts • Study of the genetics of gene expression in pedigrees using blood samples. • Blood was collected from 455 individuals from 51 Icelandic families (Most families were dense three generation pedigrees). • Samples were expression profiled against a common reference pool. • Samples were genotyped for 1000 markers across the genome. • Each of the 455 individuals was scored for 40 clinical traits.
RG1003 falls under linkage peak for obesity in females RG1003 supported by obesity/diabetes linkages in the published literature RG1003 supported by Decode Linkage Obese females Kissebah et al. 2000 RG1003 RG1033 has cis-acting QTL in Decode family blood expression data RG1003 RG1003
Overlap between cQTL and eQTL Cis eQTL for RG1003 C03 BMI>35 aka GPR105 RG1033 LD1 LD2 High-expressor allele for RG1003 associates with high BMI LOD LD1 LD2 The best single marker association
These same approaches can be used to functionate the large number of GWA studies getting dumped in the public domain today WTCC paper reports GWA results for 7 common diseases; coming along side this was a paper focusing on the T1D associations, where genes corresponding to the associations are identified et al.
In the T1D Paper Genes Corresponding to the Associations in the WTCCC Paper are identified • But what functional support is provided for these identifications? • Consider the chr 12q13 association and the identification of ERBB3: • The gene was closest to the associated SNP • SH2B3 binds ERBB3, where ITAMs bind proteins like SH2B3 with SH2 signaling domains involved in immune inflammatory events that lead to autoimmune pancreatic beta-cell destruction in T1D
1MB Window Genes Adjacent to rs11171739 rs11171739 Cis eSNP Distribution (Liver) > 10% of cis eSNPS > 10% of cis eSNPS
Rps26, but NOT ERBB3 Is Significantly Associated with rs11171739 in Cis • ERBB3 expression activity has 2 suggestive trans eQTL, but is not at all linked to the T1D SNP • The Rps26 expression trait is very strongly linked to the T1D SNP; nearly 40% of the in vivo expression of this gene is explained by this SNP • Other genes strongly linked to the T1D SNP in trans are homologs of the Rps26 gene
But now look at probabilistic causal networks • All crosses, all • tissues • Liver • Adipose • Skeletal muscle • Islets • Whole brain • Hypothalamus Rps26 T1D KEGG pathway genes Schadt E, et al., PLoS Biology, 2008
What about ERBB3 network in mouse? No functional enrichment in network genes (no T1D association)
AD sub-network GO: inflammation GO: anti-apoptosis Legends: Red: risk factor Yellow: progression marker (proteomic candidates) Rectangle: association marker (proteomic data) APOE NPTXR VGF CDK5R2 MAPT BDNF APBB1IP A2M GO:Synaptic transmission (p_value = 1.3e-12)
How to understand phosphorylation changes detected by proteomics? • 16 proteins’ phosphorylation states changed after inducing PIN1 siRNA (16 proteomic hits); • Gene expression signature of PIN1 siRNA is also defined; • Phosphorylation change is the primary signal, gene expression change is amplified signature. • Do the two types of signals match?
The two types of signals match around PIN1 PIN1 Diamond: phosphorylation Red: gene expression
MP Rutper Vessey Informatics, Biosoft, Biology GEL, GEM • Merck Collaborators • Obesity/Diabetes • Marc Reitman • Nancy Thornberry • Doug MacNeil • Charles Rosenblum • Su Chen • Shirly Pinto • Brian Kennedy • Joe Mancini • Joel Berger • Sajjad A. Qureshi • Cardiovascular • Sam Wright • Carl Sparrow • Marty Springer • Gerry Waters • Kenny Wong • Sleep • John Renger • Alzheimber’s • David Stone • Cancer • Stephen Friend • Theresa Zhang • Joseph Marszalek • Andrew Bloecher • Vinayak Kulkarni • ACSM • Jeff Sachs • Arthur Fridman • Matthew C. Wiener • Eric Minch • Metabolite/Toxicogenomics • Frank Sisteria • Bill scheffer • Ethan Xu • Qiuwei Xue • Other Merck Collaborators • Andy Plump • Larry Peterson • Erik Lund • Genetics • Eric Schadt • Biology/New Targets • John Lamb • Pek Lum • Valur Emilsson • Jonathan Derry • Michael Coon • I-Ming Wang • Debraj GuhaThakurta • Tao Xie • Xia Yang • Network/Systems Biology • Jun Zhu • Bin Zhang • Radu Dobrin • Zhidong Tu • Dmitri Volfson • Mani Narayanan • Data management/HP computing • Andrew Kasarskis • Archie Russell • Xavier Schildwachter • Eugene Chudin • Statistical Genetics • Cliona Molony • Solly Sieberts • Josh Millstein • Ke Hao • Hunter Fraiser • finance/admin) • PMs: Sonia, Christine, and Rob* • Chunsheng Zhang* • External Collaborators • UW • Steve Schwartz • Roger Baumgarner • UWisc • Attiegroup • UCLA • Jake Lusis • UNL/UNC • Daniel Pomp • Decode • Kari Stefansson • NSI • Yanqing Chen • Harvard • Jun Liu • Berkerley • Rachel Brem • Princeton • Lenoid Kruglyak