Understanding Ecosystems: Energy Flow, Trophic Levels, and Nutrient Cycling
Ecosystems comprise associations of organisms and their physical environments, interconnected through energy flow and material cycling. This chapter explores modes of nutrition, detailing autotrophs that harness sunlight or chemicals, and heterotrophs that extract energy from other organisms. It discusses the structure of food webs, the significance of trophic levels, energy losses at each level, and the concept of bioaccumulation. Additionally, it covers biogeochemical cycles, emphasizing the hydrologic, atmospheric, and sedimentary cycles that drive nutrient flow within ecosystems.

Understanding Ecosystems: Energy Flow, Trophic Levels, and Nutrient Cycling
E N D
Presentation Transcript
Ecosystems Chapter 48
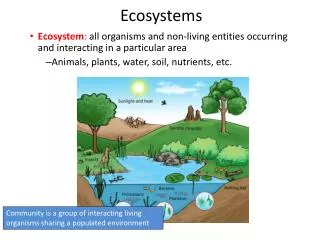
Ecosystem An association of organisms and their physical environment, interconnected by ongoing flow of energy and a cycling of materials
Modes of Nutrition • Autotrophs • Capture sunlight or chemical energy • Producers • Heterotrophs • Extract energy from other organisms or organic wastes • Consumers, decomposers, detritivores
Simple Ecosystem Model energy input from sun PHOTOAUTOTROPHS (plants, other producers) nutrient cycling HETEROTROPHS (consumers, decomposers) energy output (mainly heat)
SPRING Consumers • Herbivores • Carnivores • Parasites • Omnivores • Decomposers • Detritivores fruits insects rodents, rabbits birds SUMMER fruits rodents, rabbits insects birds Seasonal variation in the diet of an omnivore (red fox)
Trophic Levels • All the organisms at a trophic level are the same number of steps away from the energy input into the system • Producers are closest to the energy input and are the first trophic level
Trophic Levels in Prairie Fourth-level consumers (heterotrophs): Top carnivores, parasites, detritivores, decomposers 5th Third-level consumers (heterotrophs): 4th Carnivores, parasites, detritivores, decomposers Second-level consumers (heterotrophs): 3rd Carnivores, parasites, detritivores, decomposers First-level consumers (heterotrophs): 2nd Herbivores, parasites, detritivores, decomposers Primary producers (autotrophs): 1st Photoautotrophs, chemoautotrophs
Food Chain MARSH HAWK • A straight line sequence of who eats whom • Simple food chains are rare in nature UPLAND SANDPIPER GARTER SNAKE CUTWORM
Energy Losses • Energy transfers are never 100 percent efficient • Some energy is lost at each step • Limits the number of trophic levels in an ecosystem
Grazing Food Web Detrital Food Web Two Types of Food Webs Producers (photosynthesizers) Producers (photosynthesizers) decomposers herbivores carnivores detritivores decomposers ENERGY OUTPUT ENERGY OUTPUT
Biological Magnification A nondegradable or slowly degradable substance becomes more and more concentrated in the tissues of organisms at higher trophic levels of a food web
DDT in Food Webs • Synthetic pesticide banned in the United States since the 1970s • Birds that were top carnivores accumulated DDT in their tissues
Primary Productivity • Gross primary productivity is ecosystem’s total rate of photosynthesis • Net primary productivity is rate at which producers store energy in tissues in excess of their aerobic respiration
Primary Productivity Varies • Seasonal variation • Variation by habitat • The harsher the environment, the slower plant growth, the lower the primary productivity
Silver Springs Study • Aquatic ecosystem in Florida • Site of a long-term study of a grazing food web third-level carnivores (gar, large-mouth bass) Biomasspyramid 1.5 second-level consumers (fishes, invertebrates) 1.1 first-level consumers (herbivorous fishes, turtles, invertebrates) 37 decomposers, detritivores (bacteria, crayfish) primary producers (algae, eelgrass, rooted plants) 809 5
Pyramid of Energy Flow • Primary producers trapped about 1.2 percent of the solar energy that entered the ecosystem • 6-16% passed on to next level top carnivores 21 carnivores decomposers detritivores 383 herbivores 3,368 producers 20,810 kilocalories/square meter/year
All Heat in the End • At each trophic level, the bulk of the energy received from the previous level is used in metabolism • This energy is released as heat energy and lost to the ecosystem • Eventually, all energy is released as heat
Biogeochemical Cycle • The flow of a nutrient from the environment to living organisms and back to the environment • Main reservoir for the nutrient is in the environment
Three Categories • Hydrologic cycle • Water • Atmospheric cycles • Nitrogen and carbon • Sedimentary cycles • Phosphorus and sulfur
Hydrologic Cycle Atmosphere precipitation onto land 111,000 wind driven water vapor 40,000 evaporation from land plants (evapotranspiration) 71,000 evaporation from ocean 425,000 precipitation into ocean 385,000 surface and groundwater flow 40,000 Oceans Land
Hubbard Brook Experiment • A watershed was experimentally stripped of vegetation • All surface water draining from watershed was measured • Removal of vegetation caused a six-fold increase in the calcium content of the runoff water
Hubbard Brook Experiment losses from disturbed watershed time of deforestation losses from undisturbed watershed
Phosphorus Cycle • Phosphorus is part of phospholipids and all nucleotides • It is the most prevalent limiting factor in ecosystems • Main reservoir is Earth’s crust; no gaseous phase
Phosphorus Cycle mining FERTILIZER excretion GUANO agriculture weathering uptake by autotrophs uptake by autotrophs weathering MARINE FOOD WEBS DISSOLVED IN OCEAN WATER DISSOLVED IN SOILWATER, LAKES, RIVERS LAND FOOD WEBS death, decomposition death, decomposition leaching, runoff sedimentation setting out uplifting over geolgic time ROCKS MARINE SEDIMENTS
Human Effects • In tropical countries, clearing lands for agriculture may deplete phosphorus-poor soils • In developed countries, phosphorus runoff is causing eutrophication of waterways
Carbon Cycle • Carbon moves through the atmosphere and food webs on its way to and from the ocean, sediments, and rocks • Sediments and rocks are the main reservoir
volcanic action photosynthesis TERRESTRIAL ROCKS weathering Carbon Cycle diffusion Atmosphere Bicarbonate, carbonate Terrestrial Rocks Land Food Webs Marine food webs Soil Water Peat, Fossil Fuels Marine Sediments
Carbon in the Oceans • Most carbon in the ocean is dissolved carbonate and bicarbonate • Ocean currents carry dissolved carbon
Carbon in Atmosphere • Atmospheric carbon is mainly carbon dioxide • Carbon dioxide is added to atmosphere • Aerobic respiration, volcanic action, burning fossil fuels • Removed by photosynthesis
Greenhouse Effect • Greenhouse gases impede the escape of heat from Earth’s surface
Global Warming • Long-term increase in the temperature of Earth’s lower atmosphere
Carbon Dioxide Increase • Carbon dioxide levels fluctuate seasonally • The average level is steadily increasing • Burning of fossil fuels and deforestation are contributing to the increase
Other Greenhouse Gases • CFCs - synthetic gases used in plastics and in refrigeration • Methane - produced by termites and bacteria and cow burps • Nitrous oxide - released by bacteria, fertilizers, and animal wastes
Store Liquid CO2 on Ocean Bottom? • “At shallow depths liquid carbon dioxide will rise to the surface. But based on laboratory experiments with carbon dioxide hydrates, researchers imagined that liquid carbon dioxide put deep in the ocean would form a stable layer on the seafloor with a skin of solid hydrate as a boundary, like a pond covered by ice in winter.” from the Monterey Bay Aquarium Research Institute http://www.cnn.com/NATURE/9905/10/oceans.enn/
Nitrogen Cycle • Nitrogen is used in amino acids and nucleic acids • Main reservoir is nitrogen gas in the atmosphere
Nitrogen Cycle GASEOUS NITROGEN (N2) IN ATMOSPHERE NITROGEN FIXATION by industry for agriculture FOOD WEBS ON LAND uptake by autotrophs excretion, death, decomposition uptake by autotrophs FERTILIZERS NO3- IN SOIL NITROGEN FIXATION NITROGENOUS WASTES, REMAINS IN SOIL NH3-,NH4+ IN SOIL 2. NITRIFICATION AMMONIFICATION NO2- IN SOIL loss by leaching loss by leaching 1. NITRIFICATION
Nitrogen Fixation • Plants cannot use nitrogen gas • Nitrogen-fixing bacteria convert nitrogen gas into ammonia (NH3) • Ammonia and ammonium can be taken up by plants
Ammonification & Nitrification • Bacteria and fungi carry out ammonification, conversion of nitrogenous wastes to ammonia • Nitrifying bacteria convert ammonium to nitrites and nitrates
Nitrogen Loss • Nitrogen is often a limiting factor in ecosystems • Nitrogen is lost from soils via leaching and runoff • Denitrifying bacteria convert nitrates and nitrites to nitrogen gas (often occurs in water logged soil)
Human Effects • Humans increase rate of nitrogen loss by clearing forests and grasslands • Humans increase nitrogen in water and air by using fertilizers and by burning fossil fuels • Too much or too little nitrogen can compromise plant health
Sewage spill hits Peachtree Creek, Chattahoochee • Over a million gallons of raw sewage poured into a creek Monday just upstream of the Chattahoochee River and near the spot where Atlanta draws its drinking water. • Before a collapsed 36-inch sewer pipe was repaired, sewage flowed into Peachtree Creek at the rate of 10,000 gallons a minute for two hours, said Janet Ward, a spokeswoman for Atlanta's Watershed Management Department. The incident occurred near the Chattahoochee Water Treatment Plant off Bolton Road, where the city gets drinking water. The Atlanta Journal-ConstitutionPublished on: 11/29/05
Dead WatersMassive oxygen-starved zones are developing along the world's coasts • “Summer tourists cruising the waters off Louisiana or Texas in the Gulf of Mexico take in gorgeous vistas as they pull in red snappers and blue marlins. Few realize that the lower half of the water column below them may lack fish, despite the piscine bounty near the surface.”
Nitrates and Phosphates Contributions from Fertilizers • “Typically, they appear where a river spews rich plumes of nutrients into water that's stratified because of either temperature or salinity differences between the bottom and the top of the water column. If the water doesn't mix, oxygen isn't replenished in the lower half.”
Bacteria Use Up Most of the O2 • “the Mississippi River deposits water that is heavily enriched with plant nutrients, principally nitrate. This pollutant fertilizes the abundant growth of tiny, floating algae. As blooms of the algae go through their natural life cycles and die, they fall to the bottom and create a feast for bacteria. Growing in unnatural abundance, the bacteria use up most of the oxygen from the bottom water.” http://www.sciencenews.org/articles/20040605/bob9.asp