Download
1 / 16
160 likes | 179 Views
This presentation discusses the importance of equitable development in housing and transit, focusing on creating affordable homes connected to transit-oriented development. It explores policy issues such as environmental justice, social inclusion, economic mobility, and regional economic sustainability.

E N D
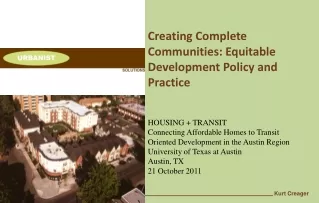
Creating Complete Communities: Equitable Development Policy and Practice HOUSING + TRANSIT Connecting Affordable Homes to Transit Oriented Development in the Austin Region University of Texas at Austin Austin, TX 21 October 2011 Kurt Creager
Equitable Housing & Transit Policy Issues • Environmental Justice • Social Inclusion • Economic Mobility • Access and Linkage to Opportunity • Regional Economic Sustainability
Combined Transportation & Housing Costs by Income in Austin/Travis County • less than 45% • more than 45% • Austin Average 43.8% • Travis County Average 46.6% • Housing Costs factored as a percent of income has widely been utilized as a measure of affordability. Traditionally, a home is considered affordable when the costs consume no more than 30% of household income. • Center for Neighborhood Technology: H+T Affordability Index
Combined Transportation & Housing Costs by Income in Phoenix/Maricopa County • less than 45% • more than 45% • Phoenix Average 46.9% • Maricopa County Average 50.1% • Housing Costs factored as a percent of income has widely been utilized as a measure of affordability. Traditionally, a home is considered affordable when the costs consume no more than 30% of household income. • Center for Neighborhood Technology: H+T Affordability Index
Combined Transportation & Housing Costs by Income in Dallas/Dallas County • less than 45% • more than 45% • Dallas Average 41.8% • Dallas County Average 43.8% • Housing Costs factored as a percent of income has widely been utilized as a measure of affordability. Traditionally, a home is considered affordable when the costs consume no more than 30% of household income. • Center for Neighborhood Technology: H+T Affordability Index
Combined Transportation & Housing Costs by Income in Houston/Harris County • less than 45% • more than 45% • Houston Average 42.7% • Harris County Average 45.9% • Housing Costs factored as a percent of income has widely been utilized as a measure of affordability. Traditionally, a home is considered affordable when the costs consume no more than 30% of household income. • Center for Neighborhood Technology: H+T Affordability Index
Combined Transportation & Housing Costs by Income in Portland/Multnomah County Oregon • less than 45% • more than 45% • Portland Average 44.4% • Multnomah County Average 45.6% • Housing Costs factored as a percent of income has widely been utilized as a measure of affordability. Traditionally, a home is considered affordable when the costs consume no more than 30% of household income. • Center for Neighborhood Technology: H+T Affordability Index
Transportation and Household Expenses • Transportation related costs make up a significant share of household expenditures, particularly for lower-income households and those located in neighborhoods with limited access to transit • Source: Center for TOD Housing + Transportation Affordability Index, 2004 Bureau of Labor Statistics
Cultural Generation Gap Analysis Leading States
Transit Rich* Neighborhoods Observed • Whether caused by displacement or • replacement or some combination of the two, • the result is much the same: the gentrified • neighborhood is more expensive and populated • by higher-income residents. • - Transit utilization fell in over half of the TRNs studied, while private auto ownership increased • Median family income rose in 9 of 10 newly served TRNs and homeownership rates increased at the expense of rental tenure • Incomes increased by at least 20 % in over half the newly served TRNs • Racial and ethnic composition did not significantly change in newly served TRNs • * 3,300 Neighborhoods served by fixed guide way transit stations were evaluated & compared for demographic and transit utilization changes • NORTHEASTERN UNIVERSITY: DUKAKIS CENTER FOR URBAN & REGIONAL POLICY
Principles of Equitable Development Vital; mixed use with abundant urban open space and amenities promotes active living. Unique place types should respect local & regional qualities. Inclusive; 25%-40% affordable with a mix of incomes and uses to live, work, play & learn creates linkage for people to opportunities and choices. Accessible; barrier free and affirming to families, elders and people with disabilities. Sustainable; best practices in energy and environmental design. Affordable and cost effective for the economic life of the property.
Equitable Transit Oriented Development Practice: Eastside Village Plano Texas • - 234 unit Mixed use “Transit Village” on DART line; studio, one, and two bedroom market rate rental apartments @ 65 d.u. / acre • Turnkey dual use parking garage with 5 levels of structured Parking; 351 in garage, 47 surface. 1.7 car / d.u. • - $17.7 million TDC; the City of Plano credited $2,000,000 against land transferred by DART to Plano and leased the site to the developer for 70 years with a Lease Escalator tied to NOI. Off-site infrastructure and fees paid by developer were credited against rent the 1st and 2nd year.
Equitable Transit Oriented Development Practice: Holly Street Village Pasadena California • -Mixed Income (20 % BMR Rental with PBRA) • -Adaptive reuse & preservation of Pasadena Hall of Justice • 168 one bedroom, (190) two and three bedroom apartments, and (16) lofts within the renovated Hall of Justice. 11,000 square feet of ground floor retail gross density 55 D.U. / AC. • $56 million TDC funded with $6.9 million in low interest loans underwritten by the city and $7.2 million in tax exempt bonds issued by the Pasadena Redevelopment Agency. • Built over LRT Station platform; Gold Line to Los Angeles Union Station • -Arts District destination neighborhood • -Strong urban submarket with 97% occupancy
Equitable Transit Oriented Development Practice: Esther Short Commons, Vancouver, Washington • -160 mixed income units: 75% below 60% AMI; 13% market rate & 12% extremely low income • 20,000 square feet of commercial space • Adjacent to bus transit center • Minimal surface parking at .63 spaces/unit • 95% occupancy maintained five years after completion • Public housing authority served as the managing general partner and co-developer with retail investor • HUD Secretary-AIA Award for best Urban Mixed Use project in the USA in 1995
Where do we go from here? • …if sustainable urbanism is "not directed by and toward principles of equity, then they will almost certainly end up reinforcing patterns of eco-apartheid“… • Andrew Ross: Bird on Fire Oxford University Press 2011