Download
1 / 22
220 likes | 358 Views
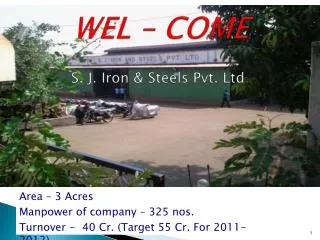
WEL – COME S. J. Iron & Steels Pvt. Ltd . Area – 3 Acres Manpower of company – 325 nos. Turnover - 40 Cr. (Target 55 Cr. For 2011-2012). Our Team. Team Members. Team Members. Team Formation Meeting. Date Of Quality Circle Formed :- 17.10.2011

E N D
WEL – COMES. J. Iron & Steels Pvt. Ltd. Area – 3 Acres Manpower of company – 325 nos. Turnover - 40 Cr. (Target 55 Cr. For 2011-2012)
Team Formation Meeting • Date Of Quality Circle Formed :- 17.10.2011 • Co-ordinator, Facilitator & Team leader formed • Name of quality circle decided.- PRAKASH QULITY CIRCLE
Name of Quality Circle – PRAKASH QUALITY CIRCLE • Name of the members 1)Mr. P.B. MALI– Co-ordinator 2) Mr.V.D.RAVAN- Facilitator
Problem Selection To Reduce Furnace B/D Activities performed • Data collection of last three months. • Group discussion on B/D • B/D details study. • Problem Selected based on data last three month .
DATA COLLECTION • ACTUAL DETAILS FROM LAST 3 MONTHS
DATA COLLECTIONS • Activities Performed 1.Checking lead condition 2.Checking Coil condition 3. Checking Water PPM 4. Checking Water Clean Condition 5. Checking Water Conductivity 6. Checking Water Flow Of Pipe 7. Checking Increase Current Of f/c.
Cause & effect diagram for F/c water high temperature Man Machine Coil cleaning ? Voltage & current proper? Lining condition ? Softener plant work in process? Timeto time water level? Is coil in good condition ? PPM checking ? Lead rinsing ? F/c Water High Temp F/c coil area cleaning ? Good material? Check rusty material? Centering is ok? No moisture material use? Increase power? Material taking ? Method Material
Cause & effect diagram for F/c water high temperature Man Machine Softener plant work in process? PPM checking ? F/c Water High Temp Two Causes are selected for further analysis GAS REJECTION– OIL FILTER ADAPTER Method Material
Why Why AnalysisWhy Why Analysis for Caused 1 – Softening Plant Lead choke up Due to scaling Water PPM is high above 50 PPM Dirty Water • Water mix with fine dust particles & resin Softening plant not working Strainers of softening plant damaged Incoming pressure was high & strainers capacity not proper
Action Taken Activities performed • Strainers replaced with proper capacity. • Control valve & pressure gauge fitted for inlet water. • 10 micron filter fitted in incoming & outgoing softener piping.
Why Why AnalysisWhy Why Analysis for Caused 2 – PPM Checking Raw water hardness 300 PPM Soft water hardness 300 PPM Water tank water level proper
Action Taken Activities performed • Cleaned water flow of F/c coil. • Raw water PPM 5 . • Soft water PPM 5. • Lead cleaned with acid in Monday work . • Water tank level proper . • Water PPM daily checked.
DATA COLLECTION ACTUAL DETAILS FROM LAST 5 MONTHS