CUAHSI Hydrologic Information Systems
430 likes | 557 Views
This document provides a comprehensive overview of the CUAHSI Hydrologic Information Systems (HIS), detailing its architecture, server functionalities, and data discovery and delivery mechanisms. CUAHSI, the Consortium of Universities for the Advancement of Hydrologic Science, focuses on integrating various hydrologic datasets into a unified Digital Watershed, which synthesizes hydrologic observations, geospatial data, weather, and remote sensing information. The document includes key components like the HIS server and web services and emphasizes the collaborative effort of universities in advancing hydrologic science.

CUAHSI Hydrologic Information Systems
E N D
Presentation Transcript
CUAHSI Hydrologic Information Systems David R. Maidment and Ernest To Center for Research in Water Resources, University of Texas at Austin Hydrosystems Laboratory University of Illinois at Urbana-Champaign, 18 August 2006
CUAHSI Hydrologic Information Systems • Introduction • HIS Server • CUAHSI web services • Demo by of Corpus Christi Bay by Ernest To • Data models and some longer range thinking
CUAHSI Hydrologic Information Systems • Introduction • HIS Server • CUAHSI web services • Demo of Corpus Christi Bay by Ernest To • Data models and some longer range thinking
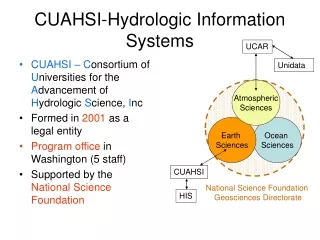
CUAHSI-Hydrologic Information Systems UCAR • CUAHSI –Consortium of Universities for the Advancement of Hydrologic Science, Inc • Formed in 2001 as a legal entity • Program office in Washington (5 staff) • Supported by the National Science Foundation Unidata Atmospheric Sciences Earth Sciences Ocean Sciences CUAHSI National Science Foundation Geosciences Directorate HIS
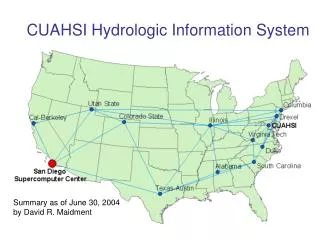
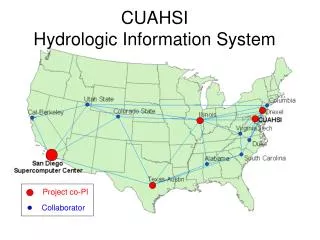
CUAHSI Member Institutions 115 Universities as of August 2006
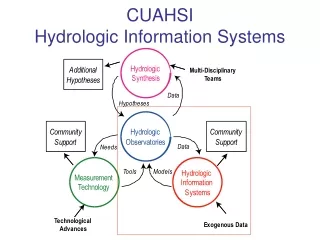
Common Vision: WATERS Network Informatics Observatories/ Environmental Field Facilities Sensors and Measurement Facility Synthesis A combined CLEANER-CUAHSI effort
CUAHSI Hydrologic Information Systems • Introduction • HIS Server • CUAHSI web services • Demo of Corpus Christi Bay by Ernest To • Data models and some longer range thinking
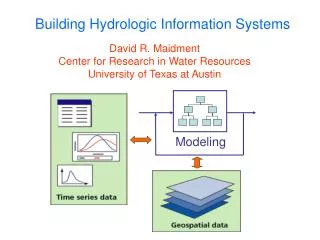
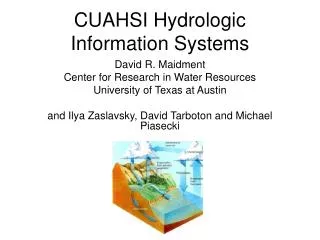
Digital Watershed How can hydrologists integrate observed and modeled data from various sources into a single description of the environment?
Digital Watershed Hydrologic Observation Data Geospatial Data (GIS) (Relational database) Digital Watershed Weather and Climate Data Remote Sensing Data (NetCDF) (EOS-HDF) A digital watershed is a synthesis of hydrologic observation data, geospatial data, remote sensing data and weather and climate data into a connected database for a hydrologic region
HIS Servers Hydrologic Observations Server GIS Data Server Digital Watershed Weather and Climate Server Remote Sensing Server HIS Servers provide hydrologic observations, weather and climate, GIS and remote sensing data. For HIS version 1.0, the focus isa hydrologic observations server for data from gages and monitoring sites at point locations.
CUAHSI Hydrologic Information System Levels National HIS – San Diego Supercomputer Center Map interface, observations catalogs and web services for national data sources HIS Server Workgroup HIS – research center or academic department Map interface, observations catalogs and web services for regional data sources; observations databases and web services for individual investigator data Personal HIS – an individual hydrologic scientist HIS Analyst Application templates and HydroObjects for direct ingestion of data into analysis environments: Excel, ArcGIS, Matlab, programming languages; MyDB for storage of analysis data
Supports data discovery, delivery and publication Data discovery – how do I find the data I want? Map interface and observations catalogs Data delivery – how do I acquire the data I want? Use web services or retrieve from local database Data Publication – how do I publish my observation data? Use Observations Data Model HIS Server
Observations Catalog Specifies what variables are measured at each site, over what time interval, and how many observations of each variable are available
Map front end – ArcGIS Server 9.2 (being programmed by ESRI Water Resources for CUAHSI) Relational database – SQL/Server 2005 or Express Web services library – VB.Net programs accessed as a Web Service Description Language (WSDL) HIS Server Architecture
National and Workgroup HIS National HIS Workgroup HIS National HIS has a polygon in it marking the region of coverage of a workgroup HIS server Workgroup HIS has local observations catalogs for coverage of national data sources in its region. These local catalogs are partitioned from the national observations catalogs. For HIS 1.0 the National and Workgroup HIS servers will not be dynamically connected.
Point Observations Information Model USGS Data Source Streamflow gages Network Neuse River near Clayton, NC Sites Discharge, stage (Daily or instantaneous) Variables Values 206 cfs, 13 August 2006 {Value, Time, Qualifier} • A data source operates an observation network • A network is a set of observation sites • A site is a point location where one or more variables are measured • A variable is a property describing the flow or quality of water • A value is an observation of a variable at a particular time • A qualifier is a symbol that provides additional information about the value
Data Source Network Sites Variables Values Data Discovery and Delivery HIS Server Observations Catalog Observations metadata Data Discovery Observations data Web services Data Delivery • HIS facilitates data discovery by building and maintaining observations catalogs • Data delivery occurs through web services from remote data archives or local observations databases. Water resource agencies support data delivery services.
CUAHSI Hydrologic Information Systems • Introduction • HIS Server • CUAHSI web services • Demo of Corpus Christi Bay by Ernest To • Data models and some longer range thinking
Publication services for local observations databases Ingestion Services for remote data archives Web Services with HIS Server Send data out from the server Enable users to access data in remote archives
Water Data Water quantity and quality Soil water Rainfall & Snow Modeling Meteorology Remote sensing
NWISWeb site output # agency_cd Agency Code # site_no USGS station number # dv_dt date of daily mean streamflow # dv_va daily mean streamflow value, in cubic-feet per-second # dv_cd daily mean streamflow value qualification code # # Sites in this file include: # USGS 02087500 NEUSE RIVER NEAR CLAYTON, NC # agency_cd site_no dv_dt dv_va dv_cd USGS 02087500 2003-09-01 1190 USGS 02087500 2003-09-02 649 USGS 02087500 2003-09-03 525 USGS 02087500 2003-09-04 486 USGS 02087500 2003-09-05 733 USGS 02087500 2003-09-06 585 USGS 02087500 2003-09-07 485 USGS 02087500 2003-09-08 463 USGS 02087500 2003-09-09 673 USGS 02087500 2003-09-10 517 USGS 02087500 2003-09-11 454 Time series of streamflow at a gaging station USGS has committed to supporting CUAHSI’s GetValues function
Observation Stations Map for the US Ameriflux Towers (NASA & DOE) NOAA Automated Surface Observing System USGS National Water Information System NOAA Climate Reference Network
Water Quality Measurement Sites in EPA Storet Substantial variation in data availability from states Data from Bora Beran, Drexel University
Water Quality Measurement Sites from Texas Commission for Environmental Quality (TCEQ)
CUAHSI Hydrologic Data Access System http://river.sdsc.edu/HDAS NCDC NASA EPA NWS Observatory Data USGS Arc Hydro Server will be a customization of ArcGIS Server 9.2 for serving water observational data A common data window for accessing, viewing and downloading hydrologic information
Data Sources NASA Storet Ameriflux Unidata NCDC Extract NCAR NWIS Transform CUAHSI Web Services Excel Visual Basic ArcGIS C/C++ Load Matlab Fortran Access Java Applications http://www.cuahsi.org/his/ Some operational services
CUAHSI Web Services Web Application: Data Portal • Your application • Excel, ArcGIS, Matlab • Fortran, C/C++, Visual Basic • Hydrologic model • ……………. • Your operating system • Windows, Unix, Linux, Mac Internet Simple Object Access Protocol Web Services Library
CUAHSI Hydrologic Information Systems • Introduction • HIS Server • CUAHSI web services • Demo of Corpus Christi Bay by Ernest To • Data models and some longer range thinking
Example: Corpus Christi Bay Environmental Info System • Workgroup HIS implementation • Uses ODM to store hydrology and environmental data from state agencies and academic investigators. • Contains web-services to regional data repositories (e.g. TCOON). Water quality data sites in Corpus Christi Bay (maps by Tyler Jantzen) Demo: TXHIS ODM webservice
ODM(Observations Data Model)= Observations Catalog + Values Table +Metadata Tables
How Excel connects to ODM Excel HydroObjects CUAHSI Web service • Obtains inputs for CUAHSI web methods from relevant cells. • Available Web methods are GetSiteInfo, GetVariableInfo GetValues methods. parses user inputs into a standardized CUAHSI web method request. converts standardized request to SQLquery. SQL query Observations Data Model Response converts response to a standardized XML. imports VB object into Excel and graphs it converts XML to VB object
CUAHSI Hydrologic Information Systems • Introduction • HIS Server • CUAHSI web services • Demo of Corpus Christi Bay by Ernest To • Data models and some longer range thinking
Series and Fields Features Series – ordered sequence of numbers Point, line, area, volume Discrete space representation Time series – indexed by time Frequency series – indexed by frequency Surfaces Fields – multidimensional arrays Continuous space representation Scalar fields – single value at each location Vector fields – magnitude and direction Random fields – probability distribution
North American Regional Reanalysis of Climate Evaporation Precipitation Variation during the day, July 2003 NetCDF format mm / 3 hours
Time, T D Space, L Variable, V Data Cube – What, Where, When “When” A data value “Where” “What”
Continuous Space-Time Data Model -- NetCDF Time, T Coordinate dimensions {X} D Space, L Variable dimensions {Y} Variables, V
Discrete Space-Time Data Model Time, TSDateTime TSValue Space, FeatureID Variables, TSTypeID
Hydrologic Statistics Time Series Analysis Geostatistics Multivariate analysis How do we understand space-time correlation fields of many variables?
Federal State Local Academic Water OneFlow • Like Geospatial OneStop, we need a “Water OneFlow” – a common window for water data and models • Advancement of water science is critically dependent on integration of waterinformation
Conclusions • This is a complex and important problem that will not be solved soon • Web services architecture will work and is valuable • Major water agencies are buying into our web services design, in particular the USGS • We need to think more deeply and abstractly about the way data is used to represent water and the water environment