Download
1 / 19
190 likes | 335 Views
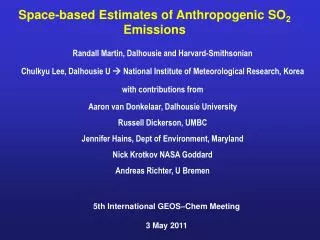
Space-based constraints on biogenic soil NO emissions. Rynda Hudman 1 , Neil Moore 2,3 , Randall Martin 2 , Ashley Russell 1 , Luke Valin 1 , Ron Cohen 1. Fall AGU Meeting B42E-08 December 16, 2010.

E N D
Space-based constraints on biogenic soil NO emissions Rynda Hudman1, Neil Moore2,3, Randall Martin2, Ashley Russell1, Luke Valin1, Ron Cohen1 Fall AGU Meeting B42E-08 December 16, 2010 1 UC Berkeley, Dept of Chemistry 2 Dalhousie University, Dept of Physics and Atmospheric 3 now at University of Manitoba, Dept of Physics & Astronomy
NOx HAS WIDESPREAD CONSEQUENCES O3 hv • Acidification & eutrophication of soils and waterways • Forest die-back • Impacts carbon sequestration • Secondary organic aerosol formation • Impacts GHG lifetimes through its effect on OH • Ozone air quality hrs - 1 day NO2 HNO3 NO
SOIL NOX EMISSIONS IMPACTS OZONE AIR QUALITY OZONE ENHANCEMENT DUE TO SOIL NOx JUNE 2006 Ozone enhancement due to soil NOx 8 ppbv, with events up to 16 ppbv Comparable to decreases predicted from power plant reductions! Hudman et al. [2010]
Most of what we know is based on point measurements, but effects are regional scale Point Measurments One day of OMI column NO2 • Global Daily Coverage (nadir = 13x24 km2) • Multi-year Timeseries (late 2004-present) • Can provide top-down constraints on regional scale • Multiple Species/Soil Conditions • Continuous Timeseries • Limited Spatial Coverage (m) • Highly variableDifficulty scaling up
LARGE SOIL NOx SOURCE INFERRED FROM SATELLITES GOME Constraints on Natural Soil and Agriculture • GLOBAL: 8.9 Tg N/yr • N. MIDLATITUDES: 3.5 Tg N/yr • TROPICS: 5.3 Tg N/yr • ~22% of global NOx source • ~60% higher than estimates used in current models X 1010 [molec cm2 s-1] [Jaeglé et al., 2005] This study constrains magnitude, but what about processes? GOME = 40 x 320 km2 OMI = 13 x 24 km2
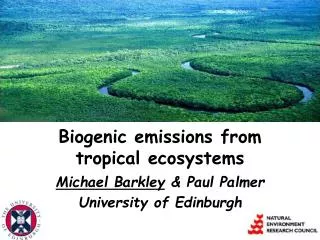
NO IS A HIGHLY VARIABLE PRODUCT OF MICROBIAL ACTIVITY IN SOILS Processes not well understood, HUGE spatial variability, but best correlation w/ wfps, T, N avail. [Meixner and Yang, 2006] ATMOSPHERE N2O(g), N2(g), NO(g) BIOSPHERE
SOIL NOx “EVENTS” pulsing over freshly fertilized Montana fields after rain event ENOx = f( T, biome, w/d, N) x Pulse (precip) x canopy uptake [Yienger and Levy, 1995] ENOx 2005-2007 [Bertram et al., GRL, 2005] We extend this work to include U.S.: daily NARR Temp & Precip MODIS Landtype Fertilizer emissions [Potter et al., 2010]
MEAN MAY-JULY 2005-2008 MODELED SOIL NOx EMISSIONS Emissions range from 3-15 ng N m2 s-1 consistent with field observations Mean Yearly Total: 0.62 Tg N/yr (Fert: 0.12 Tg N/yr) Hudman et al., [2010]
MODELED SOIL NOx EMISSIONS Dry, warm conditions anomalously high June 2006 pulsed soil emissions Mean Yearly Total: 0.62 Tg N/yr (Fert: 0.12 Tg N/yr) Hudman et al., [2010]
OMI NO2 ANOMALY FOLLOWS PATTERN PREDICTED AND ARE TOTALS COMPARE WELL Modeled Soil NOx June 2006 OMI June 2006 Anomaly Modified empirical model has some skill in capturing monthly scale soil NOx behavior, what about pulsing? Hudman et al. [2010]
PULSING OVER EASTERN SOUTH DAKOTA IN JUNE 2006 Avg. of NASA & DOMINO OMI NO2Soil Model ImprovedSoil Model StandardPrecipitation Day in June Large enough to see, reaching up to 4.6x10¹⁵ molec cm2 (2 ppbv), We can use OMI to test understanding pulsing triggers Hudman et al. [2010]
GOME EMISSIONS LARGER THAN ORIGINAL MODEL Particularly at N. Midlatitudes and N. Tropical Africa GOME – ORIGINAL YIENGER AND LEVY [1995] MODEL GOME Total: 8.9 Tg N yr-1 Orig Model: 5.5 Tg N yr-1 Red regions are where GOME emissions > original model
AN UPDATED GLOBAL MODEL OF SOIL NOx ENOx =f( T, biome, WFPS, Fert)x Pulse (dryspell) xcanopy uptake ENOx =f( T, biome, w/d, Fert)x Pulse (dryspell) xcanopy uptake ENOx =f( T, biome, w/d)x Pulse (dryspell) xcanopy uptake + FERT ENOx =f( T, biome, w/d, Fert)x Pulse (ppt) xcanopy uptake • IMPROVEMENTS: • Update Fertilizer: new maps (include N deposition), MODIS EVI seasonality and treat like other N • Update Pulsing Scheme: Yan et al., [2005] (shorter, stronger pulses) • Update moisture treatment: soil moisture as a continuous variable
GOME EMISSIONS LARGER THAN ORIGINAL MODEL Particularly at N. Midlatitudes and N. Tropical Africa GOME – ORIGINAL YIENGER AND LEVY [1995] MODEL GOME Total: 8.9 Tg N yr-1 Orig Model: 5.5 Tg N yr-1 Red regions are where GOME emissions > original model
NEW MODEL MATCHES WITH GOME OBSERVATIONS IN A BROAD SENSE NEW MODEL – ORIGINAL YIENGER AND LEVY [1995] MODEL GOME Total: 8.9 Tg N yr-1 New Model: 7.5 Tg N yr-1 Red regions are increases with updated model
INCREASES EMISSIONS BY 50% IN SUMMER & BETTER CAPTURES SEASONALITY • Update Fertilizer: new maps (include N deposition), MODIS EVI seasonality and treat like other N
MODEL IMPROVES MAGNITUDE BUT SEASONALITY SHIFTED Can we use satellite measurements to constrain soil moisture?
SOIL NOX IMPACT ON SURFACE OZONE MAXIMUM MONTHLY MEAN SOIL NOx OZONE ENHANCEMENT 2006 EPA 8-hr std =75 ppbv 40% of sfc ozone 8-10 ppbv over U.S. 3-5 ppbv over Europe 10-16 ppbv over Africa
CONCLUSIONS & FUTURE WORK • OMI observations of NO2 column densities confirmed a X2 increase in pulse driven soil NOx emissions over the agricultural United States in June 2006. • The OMI observations provide daily global coverage, which identifies soil pulsing and can be used to refine our understanding of pulsing triggers and also soil moisture in models. • Updating a global soil NOx model improves the general agreement with GOME inferred soil NOx emissions for the fertilized midlatitudes predicted 8-10 ppbv enhancement in ozone due to soil NOx over the U.S. comparable to power plant reductions. • Updating a global soil NOx model improvesmagnitude of emissions in N. equatorial regions, but misrepresents timing due to soil moisture inundation on large grid cells. We predict up to 16 ppbv monthly mean enhancements in this region (40% of surface ozone).