Download
1 / 21
210 likes | 228 Views
This study explores the relationship between marine biogenic emissions, sulfate formation, and climate using oxygen isotopes. It analyzes aerosol oxidation pathways, the INDian Ocean EXperiment (INDOEX), and the GEOS-CHEM global 3D model.

E N D
Marine biogenic emissions, sulfate formation, and climate: Constraints from oxygen isotopes Becky Alexander Harvard University Department of Earth and Planetary Sciences 6th summer institute July 21, 2004
Overview • Marine biogenic emissions, sulfate formation and climate • D17O sulfate: Aerosol oxidation pathways • INDOEX: INDian Ocean Experiment • GEOS-CHEM: Global 3D model
CS2 DMS H2S Sulfate in the Atmosphere OH, NO3 OH SO2 SO42- O3, H2O2 OH MSA Surface
Effects of Aerosols on Climate l0 Reflection l0 l0 Absorption Refraction Direct Effect Indirect Effect Cloud droplet number density (cm-3) Aerosol number density (cm-3) Ramanathan et al., 2001
Marine Biologic DMS and Climate Charleson et al. (1987) SO42- H2O2 O3 Sea-salt aerosol CCN SO2 OH H2SO4 New particle formation OH NO3 Light scattering DMS Phytoplankton
OH• Acids: H2SO4(g) HNO3(g) RCOOH(g) SO2(g) SO42- ? Na+, Cl-, CO32- pH=8 CO2(g) Alkalinity in the Marine Boundary Layer
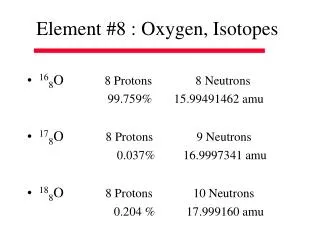
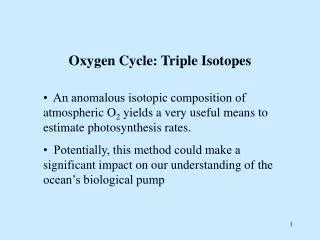
Stable Isotope Measurements: Tracers of source strengths and/or chemical processing of atmospheric constituents (‰) = [(Rsample/Rstandard) – 1] 1000 R = minorX/majorX 18O: R = 18O/16O 17O: R = 17O/16O Standard = SMOW (Standard Mean Ocean Water) (CO2, CO, H2O, O2, O3, SO42-….) d17O/d18O 0.5 D17O =d17O– 0.5*d18O = 0
Mass-Independent Fractionation +D17O -D17O D17O=d17O– 0.5*d18O 0 O + O2 O3* Mass-dependent fractionation line: d17O/d18O 0.5 Thiemens and Heidenreich, 1983 d17O/d18O 1
Source ofD17OSulfate Aqueous Gas SO2 in isotopic equilibrium with H2O : D17Oof SO2 = 0 ‰ 1) SO32-+ O3 (D17O=35‰) SO42-D17O = 8.75 ‰ 2) HSO3-+ H2O2(D17O=1.7‰) SO42-D17O= 0.85 ‰ 3) SO2 + OH(D17O=0‰) SO42-D17O= 0 ‰ D17Oof SO42- a function relative amounts of OH, H2O2, and O3 oxidation Savarino et al., 2000
pH dependency of O3 oxidation and its effect on D17O of SO42- H2O2 H2O2 O3 O3 Sea-spray Lee et al., 2001
INDOEX cruises Pre-INDOEX Jan. 1997 INDOEX March 1998
Ag2SO4 O2 + SO2 He flow Removable quartz tube magnet To vacuum 1050°C SO2 trap SO2 port vent Sample loop 5A mol.sieve O2 port To vacuum GC Analytical Method High volume air sampler Ion Chromatograph Ionic separation H2SO4 Isotope Ratio Mass Spectrometer vent O2 loop 5A mol.sieve
Subsidence other aerosols (acid or neutral) NH3(g) RCOOH(g) HNO3(g) Sea-salt aerosol CO32- O3 Deposition CO2(g) OH• Emission GEOS-CHEM Sea-salt Alkalinity http://www-as.harvard.edu/chemistry/trop/geos/index.html Free troposphere Marine Boundary Layer Subsidence Cloud SO42- H2O2 H2SO4(g) OH SO2 OH NO3 DMS Emission
Pre-INDOEX Cruise January 1997 ITCZ
INDOEX Cruise March 1998 ITCZ
GEOS-CHEM Alkalinity Budget 60°N ƒSO2 60°S 60°N ƒexcess 60°S 180°W 180°E
Effect of sea-salt chemistry on SO2 and sulfate concentrations Percent (%) change (yearly average): - Case1 Case2 ´ | 100 | Case1 60°N SO2 60°S 60°N SO42- 60°S 180°W 180°E
0% 100% 50% Effect of sea-salt chemistry on gas-phase sulfate production rates Mar/Apr/May Jun/Jul/Aug Sep/Oct/Nov Dec/Jan/Feb
Conclusions • Sulfate formation in sea-salt aerosols is limited by: • Low to mid-latitudes: sea-salt flux to the atmosphere (wind) • Mid to high-latitudes: gas-to-particle transfer rate of SO2 • SO2 plays dominant role in titrating sea-salt alkalinity • D17O constraint indicates no significant regeneration of alkalinity through NaCl + OH reaction • Large decreases in SO2 concentrations (70%) and the rate of gas-phase sulfate production (60%) in the MBL • Inclusion of sea-salt chemistry in global models is important for interpretation of Antarctic ice core D17O sulfate measurements
Acknowledgements Mark H. Thiemens Charles Lee V. Ramanathan Joël Savarino Daniel Jacob Rokjin Park Qinbin Li Bob Yantosca
SO2 Oxidation, Iron Mobilization, and Oceanic Productivity Source: www.nasa.gov Mwskhidze et al., 2003