Download

1 / 17
0 likes | 15 Views
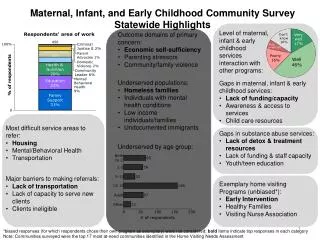
The June 2022 survey results show improvements in social connection, returning to daily activities, and mental health stemming from the pandemic. Storm-related improvements include power outages and internet outages. However, challenges persist in areas like financial hardship and dangerous trees due to the storm. The survey also reveals insights into emergency planning, access to generators, and home insurance among Yarra Ranges residents.

E N D
Pandemic and Storm Pandemic and Storm Impact Survey Impact Survey June 2022 June 2022 1
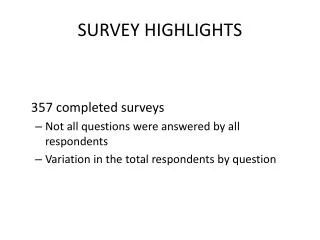
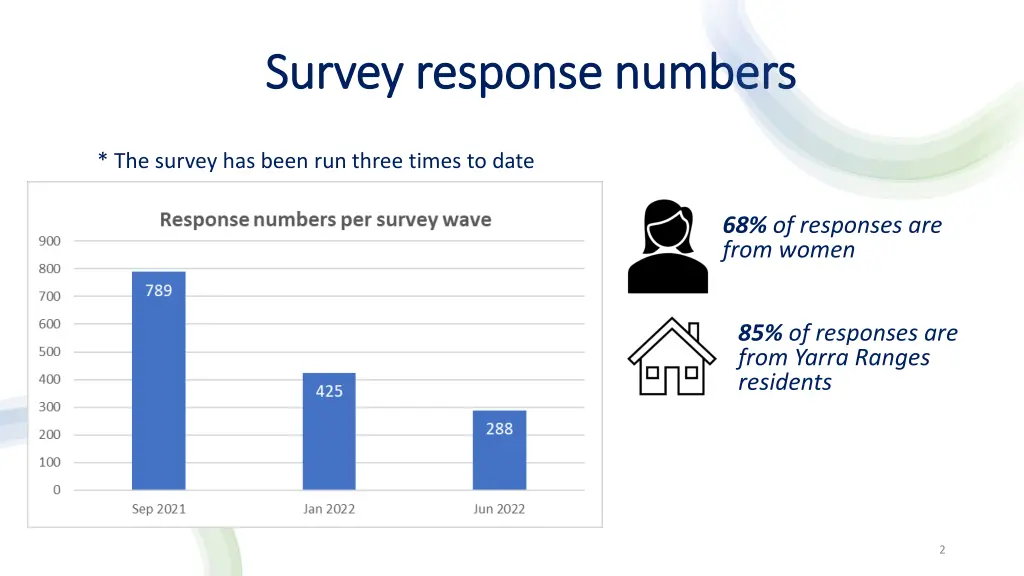
Survey response numbers Survey response numbers * The survey has been run three times to date 68% of responses are from women 85% of responses are from Yarra Ranges residents 2
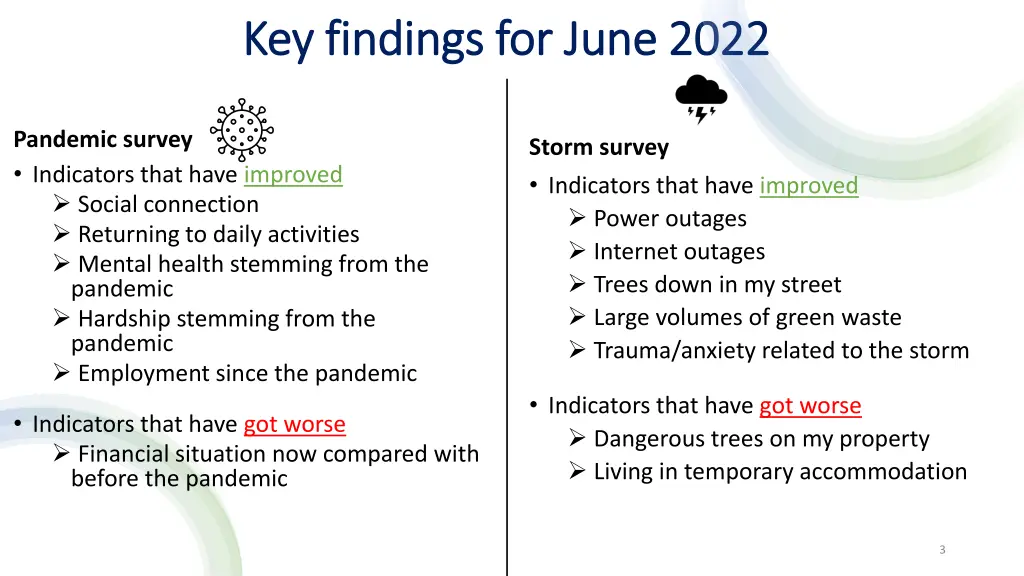
Key findings for June 2022 Key findings for June 2022 Pandemic survey • Indicators that have improved Social connection Returning to daily activities Mental health stemming from the pandemic Hardship stemming from the pandemic Employment since the pandemic Storm survey • Indicators that have improved Power outages Internet outages Trees down in my street Large volumes of green waste Trauma/anxiety related to the storm • Indicators that have got worse Dangerous trees on my property Living in temporary accommodation • Indicators that have got worse Financial situation now compared with before the pandemic 3
Pandemic Impacts Pandemic Impacts 4
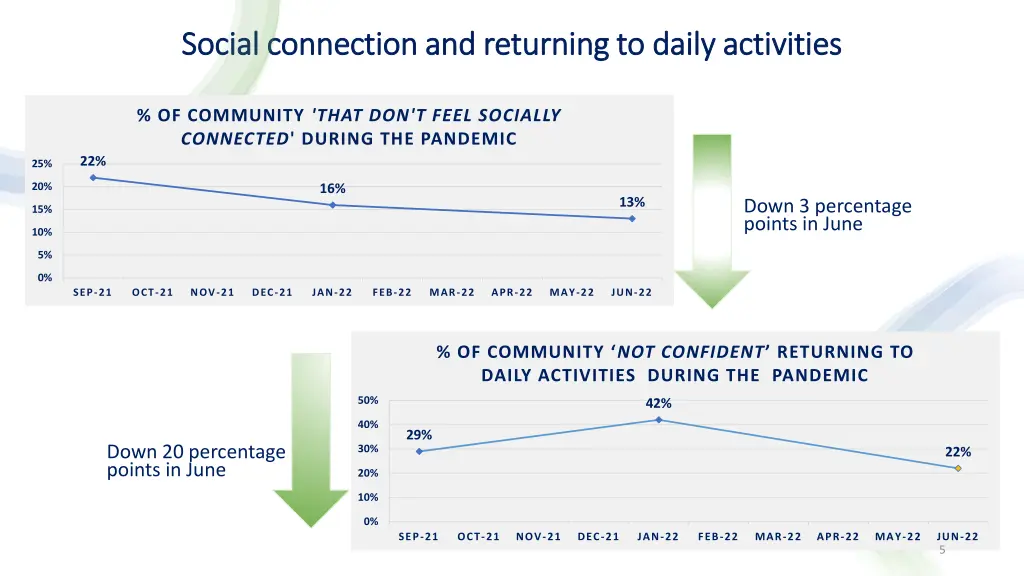
Social connection and returning to daily activities Social connection and returning to daily activities % OF COMMUNITY 'THAT DON'T FEEL SOCIALLY CONNECTED' DURING THE PANDEMIC 22% 25% 20% 16% 13% Down 3 percentage points in June 15% 10% 5% 0% SEP-21 OCT-21 NOV-21 DEC-21 JAN-22 FEB-22 MAR-22 APR-22 MAY-22 JUN-22 % OF COMMUNITY ‘NOT CONFIDENT’ RETURNING TO DAILY ACTIVITIES DURING THE PANDEMIC 50% 42% 40% 29% Down 20 percentage points in June 30% 22% 20% 10% 0% SEP-21 OCT-21 NOV-21 DEC-21 JAN-22 FEB-22 MAR-22 APR-22 MAY-22 JUN-22 5
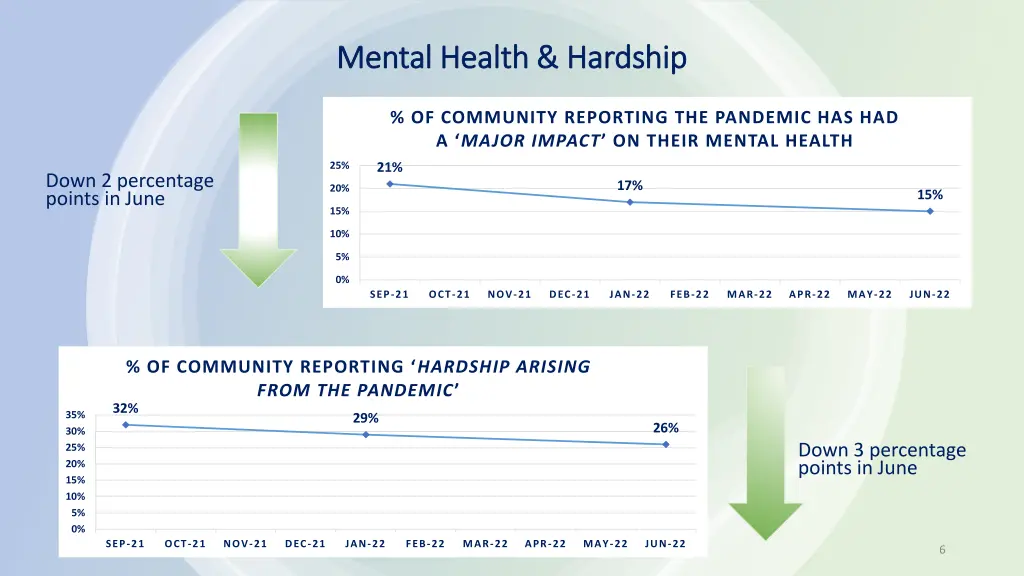
Mental Health & Hardship Mental Health & Hardship % OF COMMUNITY REPORTING THE PANDEMIC HAS HAD A ‘MAJOR IMPACT’ ON THEIR MENTAL HEALTH 25% 21% Down 2 percentage points in June 17% 20% 15% 15% 10% 5% 0% SEP-21 OCT-21 NOV-21 DEC-21 JAN-22 FEB-22 MAR-22 APR-22 MAY-22 JUN-22 % OF COMMUNITY REPORTING ‘HARDSHIP ARISING FROM THE PANDEMIC’ 32% 35% 29% 26% 30% Down 3 percentage points in June 25% 20% 15% 10% 5% 0% SEP-21 OCT-21 NOV-21 DEC-21 JAN-22 FEB-22 MAR-22 APR-22 MAY-22 JUN-22 6
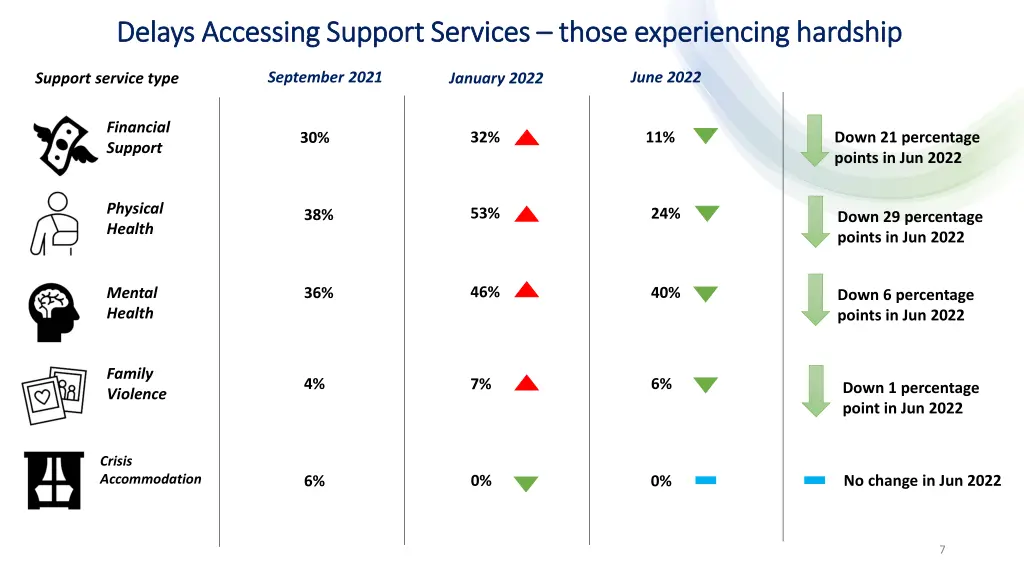
Delays Accessing Support Services Delays Accessing Support Services – – those experiencing hardship those experiencing hardship September 2021 June 2022 Support service type January 2022 Financial Support 11% 32% Down 21 percentage points in Jun 2022 30% Physical Health 53% 24% 38% Down 29 percentage points in Jun 2022 46% 40% Mental Health 36% Down 6 percentage points in Jun 2022 Family Violence 4% 6% 7% Down 1 percentage point in Jun 2022 Crisis Accommodation 0% No change in Jun 2022 6% 0% 7
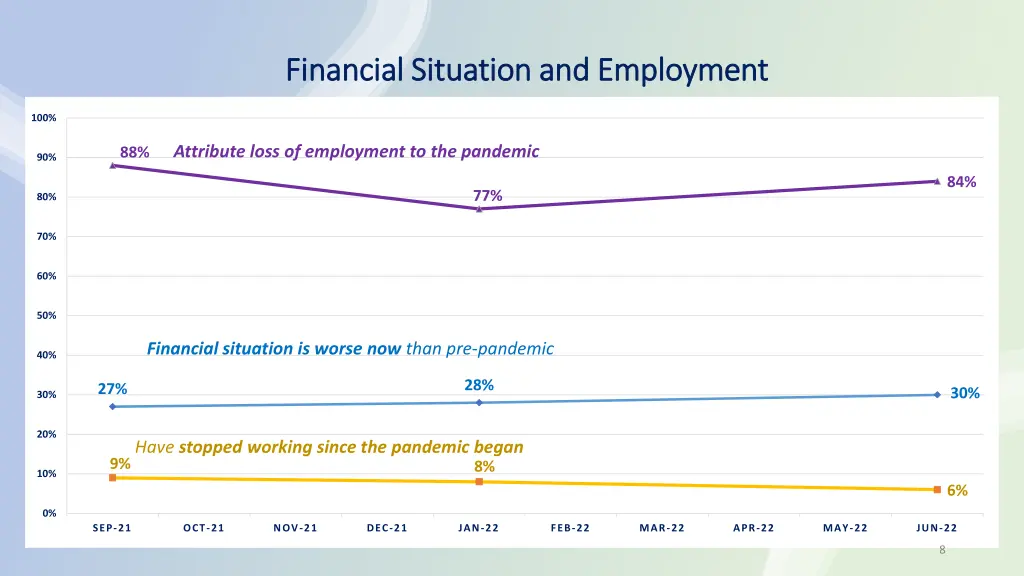
Financial Situation and Employment Financial Situation and Employment 100% Attribute loss of employment to the pandemic 88% 90% 84% 77% 80% 70% 60% 50% Financial situation is worse now than pre-pandemic 40% 28% 27% 30% 30% 20% Have stopped working since the pandemic began 9% 8% 10% 6% 0% SEP-21 OCT-21 NOV-21 DEC-21 JAN-22 FEB-22 MAR-22 APR-22 MAY-22 JUN-22 8
Storm Impacts Storm Impacts 9
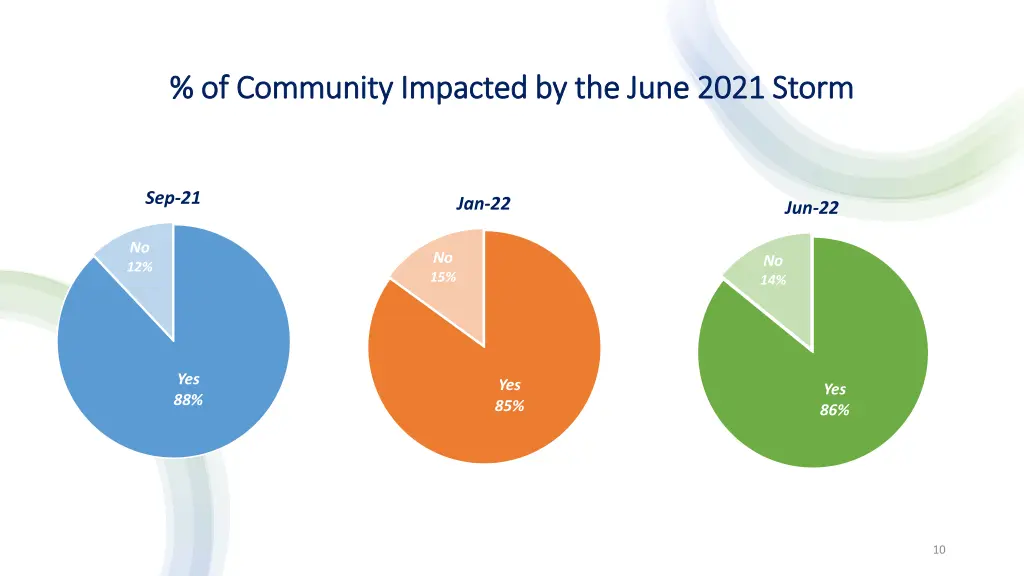
% of Community Impacted by the June 2021 Storm % of Community Impacted by the June 2021 Storm Sep-21 Jan-22 Jun-22 No 12% No 15% No 14% Yes 88% Yes 85% Yes 86% 10
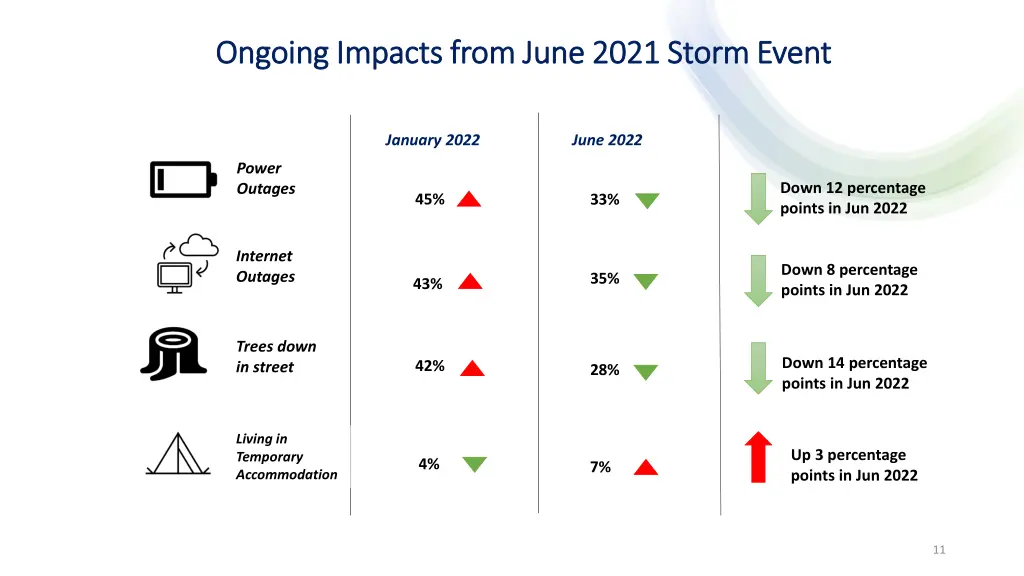
Ongoing Impacts from June 2021 Storm Event Ongoing Impacts from June 2021 Storm Event January 2022 June 2022 Power Outages Down 12 percentage points in Jun 2022 45% 33% Internet Outages Down 8 percentage points in Jun 2022 35% 43% Trees down in street Down 14 percentage points in Jun 2022 42% 28% Living in Temporary Accommodation Up 3 percentage points in Jun 2022 4% 7% 11
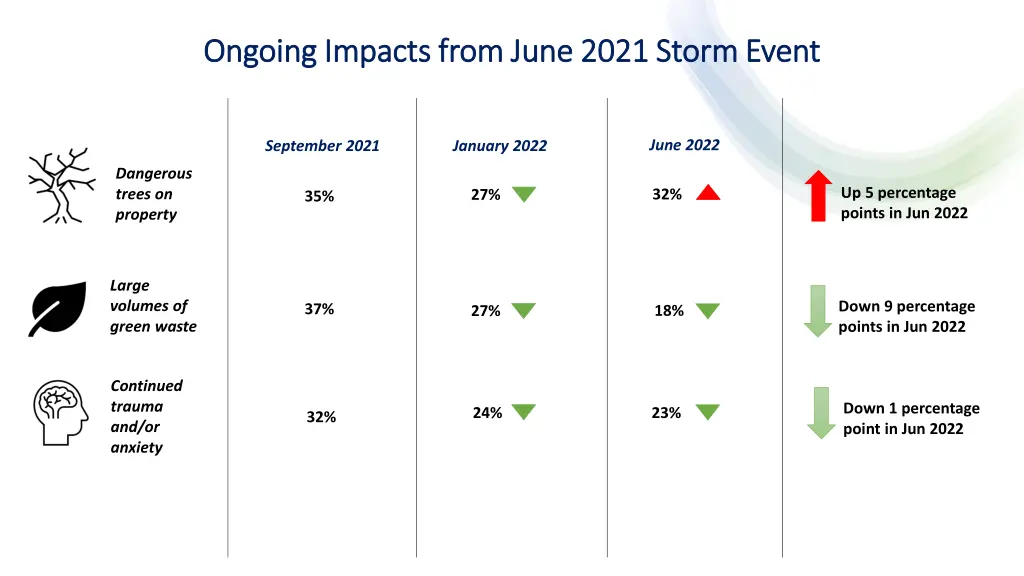
Ongoing Impacts from June 2021 Storm Event Ongoing Impacts from June 2021 Storm Event June 2022 September 2021 January 2022 Dangerous trees on property Up 5 percentage points in Jun 2022 32% 27% 35% Large volumes of green waste Down 9 percentage points in Jun 2022 37% 18% 27% Continued trauma and/or anxiety Down 1 percentage point in Jun 2022 24% 23% 32%
New survey questions New survey questions • Emergency planning Emergency planning • Generators Generators • Insurance Insurance • Support services Support services 13
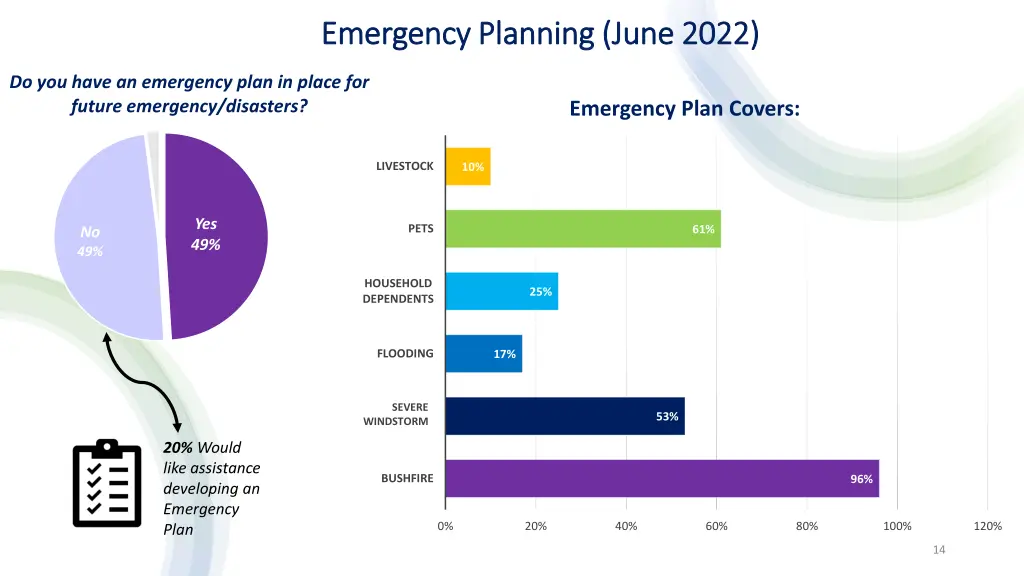
Emergency Planning (June 2022) Emergency Planning (June 2022) Do you have an emergency plan in place for future emergency/disasters? Emergency Plan Covers: LIVESTOCK 10% Yes 49% PETS 61% No 49% HOUSEHOLD DEPENDENTS 25% FLOODING 17% SEVERE SEVERE WINDSTROM WINDSTORM 53% 20% Would like assistance developing an Emergency Plan BUSHFIRE 96% 0% 20% 40% 60% 80% 100% 120% 14
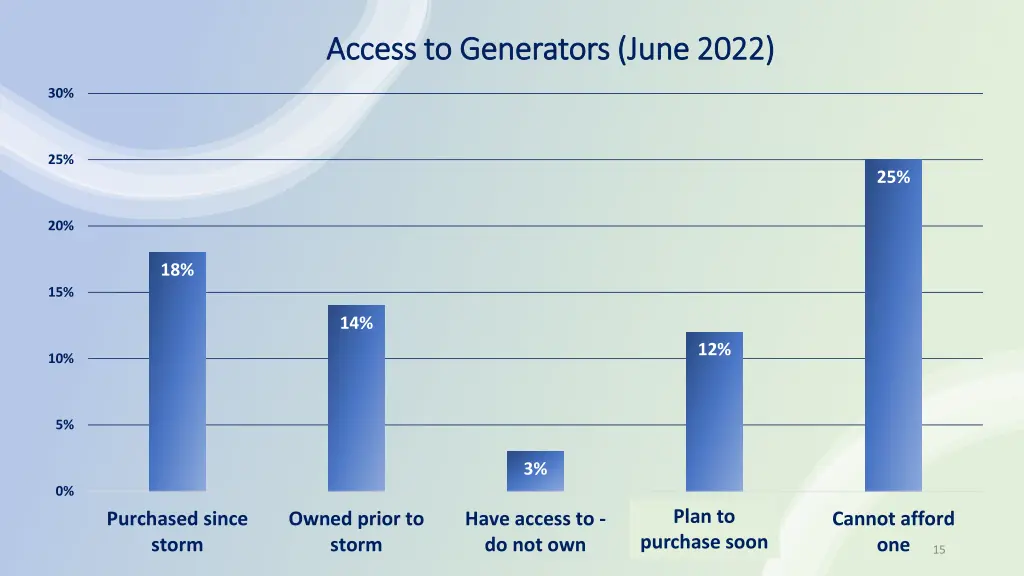
Access to Generators (June 2022) Access to Generators (June 2022) 30% 25% 25% 20% 18% 15% 14% 12% 10% 5% 3% 0% Plan to Plan to purchase soon Purchased since storm Owned prior to storm Have access to - do not own Cannot afford one purhcase soon 15
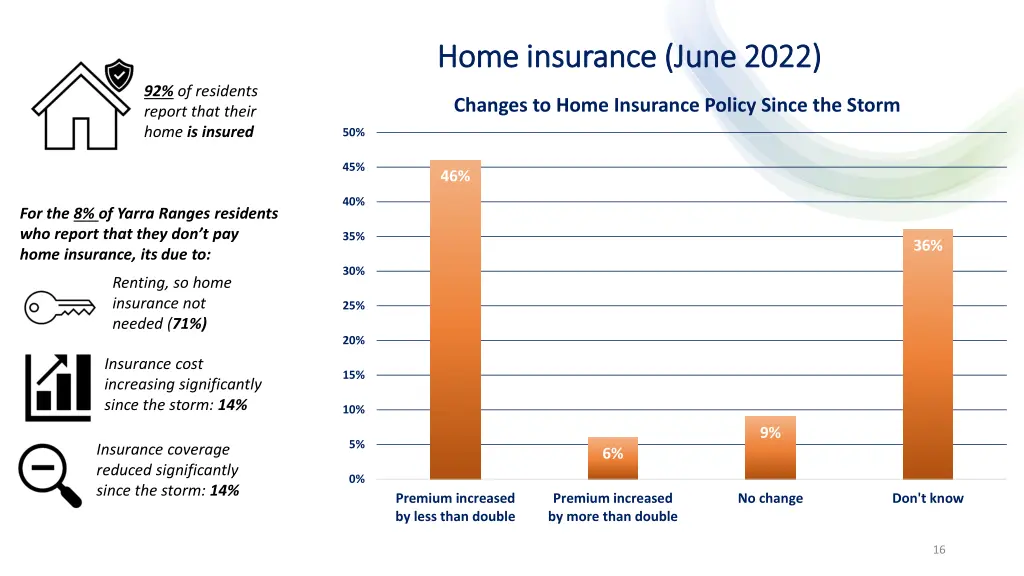
Home insurance (June 2022) Home insurance (June 2022) 92% of residents report that their home is insured Changes to Home Insurance Policy Since the Storm 50% 45% 46% 40% For the 8% of Yarra Ranges residents who report that they don’t pay home insurance, its due to: 35% 36% 30% Renting, so home insurance not needed (71%) 25% 20% Insurance cost increasing significantly since the storm: 14% 15% 10% 9% 5% Insurance coverage reduced significantly since the storm: 14% 6% 0% Premium increased by less than double Premium increased by more than double No change Don't know 16
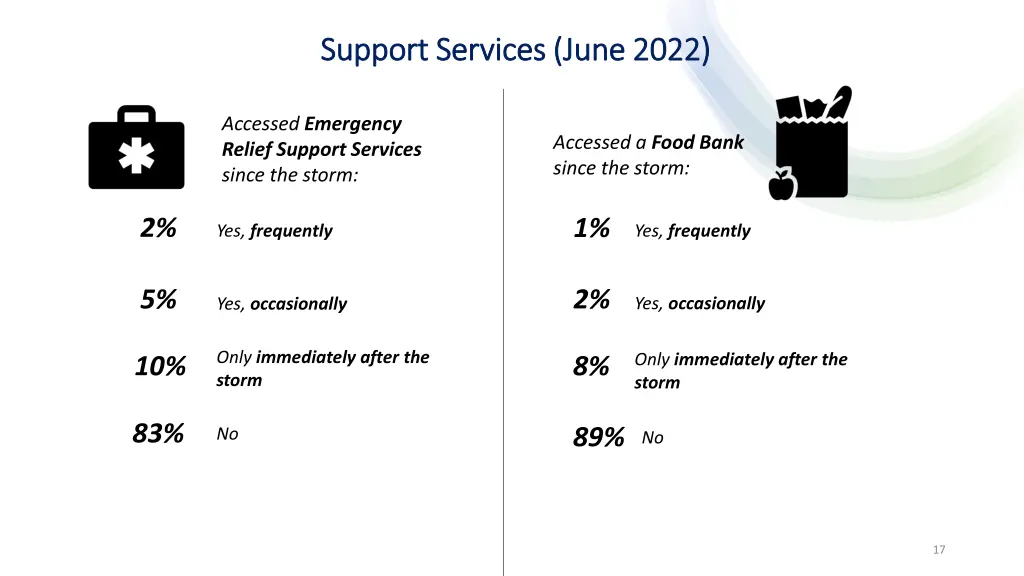
Support Services (June 2022) Support Services (June 2022) Accessed Emergency Relief Support Services since the storm: Accessed a Food Bank since the storm: 2% 1% Yes, frequently Yes, frequently 5% 2% Yes, occasionally Yes, occasionally Only immediately after the storm Only immediately after the storm 10% 8% 83% 89% No No 17