Download
1 / 15
250 likes | 819 Views
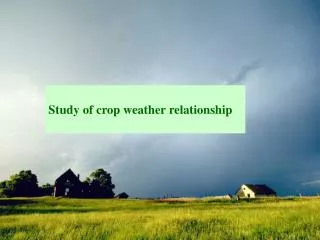
Study of crop weather relationship. Macro level study. Ramdas data 5 crops – rice , wheat, sorghum, cotton, sugar cane 20 stations – all over the country Two varieties at each station – one local, one national 25 years –1946- 1972. Records From sowing to harvest

E N D
STATSPUNE Study of crop weather relationship
STATSPUNE Macro level study • Ramdas data • 5 crops – rice , wheat, sorghum, cotton, sugar cane • 20 stations – all over the country • Two varieties at each station – one local, one national • 25 years –1946- 1972 • Records • From sowing to harvest • Dates of important events e.g. sowing, • end of germination, end of growth etc. • Measures of crop development e.g. % germination • Height of plant, yield etc. • Corresponding weather data
STATSPUNE Objectives • Early prediction of yield • Weather component of yield variability • How to begin? • Development phases that can be modeled • Seed germination • Plant growth • Yield
STATSPUNE Modeling of seed germination • Data: daily % germination • Model : Hyperbolic – shifted origin • Initial stage not observable(first 3 /4 days) • Total period 10-15 days • Y = V(x-x0) / (K+(x - x0)) • Where; x – days since sowing • x0 - shift • Y - % germination up to x days • V- max germination • K – half saturation constant • ( time when % germination if V/2)
STATSPUNE Parameter Ais God V 41.04 35.07 K .5 .86 x0 3.96 3.94
STATSPUNE Meta model • V,K regressed on weather • 1 week pre sowing, 1 week after sowing • Aispuri R2 error d.f. • V= - 101.84 + 0.40 RHH2 81% 4 • K= 0.85 -0.0005 MWV 26% 4 • Godgarya • V= - 110.5 + 0.42 RHH2 80% 8 • K= 3.14 -0.0024 MWV 34% 8 V- environment sensitive, K-genetic? • Use : anticipate failure of germination • Action – re-sowing
STATSPUNE Modeling plant growth • Data – weekly / fortnightly height records of plants • Model sigmoidal – logistic • K, r parameters – K- max height, r growth rate • Meta model • Relate K, r to weather • Literature – degree days play a measure role in growth phase • Degree days – sum of excess over 150 C in each day • Temp below 150 C not favorable for growth • Use early prediction of K – prediction of straw yield
STATSPUNE Results of meta model • Degree days in first 10 weeks after sowing are considered • Aispuri R2 error d.f. • K = - 77.0 + 0.45W1 +0.99 W5 +1.28 W7 –0.72W9 47% 15 • r = - 0.01 + 0.0001 W1 – 0.0002 (W2-W4)+ 0.0005 W7 57% 15 • Godgarya R2 error d.f. • K = - 225.0 + 0.94W1 +1.31 W5 +1.48 W7 –0.57W9 48% 15 • very low 15 Only one weather variable(degree days) used is inadequate. Additional variables may improve R2.
STATSPUNE Predicting yield using biometrical and weather variables • Biometrical variables: • Growth indicators at earlier phases of crop development • e.g. germination %, max plant height, max # shoot/ plant etc. • Contain information about weather up to that phase • not adequate to explain yield variability by themselves • Weather after completion of plant growth needs to be considered • Weather in 2 weeks after completion of plant growth is considered • 2 months before harvest • Early enough
STATSPUNE Regression model for Sorghum yield(Grain- Solapur) Predictor variables Variety 1(M-35-1) Variety 2 (ND15) Max height Max ears/sample Max shoots/sample Max shoots/sample DB1W2 DB1W1 WB1W1 WB1W1 WB1W2 ST1W2 ST1W1 RH1W2 RH1W2 -- R2 = 85% 85% d.f.(error)= 9 10
STATSPUNE Regression model for Paddy yield(Grain- Karjat) Predictor variables Variety 1(K-42) Variety 2 (no name) Max height Max height Max no of ears -- DB1W2 DB1W1, DB1W2 WB1W2 WB1W1, WB1W2 MaxTW2 MaxTW1 MinTW2 MinTW1, MinTW2 VP1W2 -- RH1W2 RH1W1 R2 = 87% 78% d.f.(error)=11 10
STATSPUNE Regression model for Paddy yield(Straw) Predictor variables Variety 1(K-42) Variety 2 (no name) -------------------------------------------------------------- Max # shoots -- Max # of ears -- DB1W1, DB1W2 DB1W2 WB1W2 WB1W1, WB1W2 MaxTW2 MaxTW1 --- MinTW2 VP1W1 VP1W1 RH1W1 RH1W1, RH1W2 R2 =75% 75% d.f.(error) = 11 9
STATSPUNE Weather component of yield variability • Factors affecting yield • Variety chosen • Locality (soil, climate) • Weather of that year • Agronomic practices Ramdas data: agronomic practices standardized across stations. Varieties fixed for a station over years, but change between stations. Varieties treated as a random effect. Variation in yield from year to year for a given station and variety – weather effect Nested model – Station(variety (year(error))) Separating error from year? Multiple plots in the same year.
STATSPUNE Variance components (sorghum grain yield)
STATSPUNE Variance Components(Paddy Grain Yield-Karjat) Source d.f. % of Total variety 1 3.21 year 32 64.56 (weather) Error 374 32.23 Total 407