Download
1 / 26
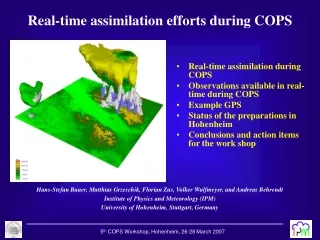
260 likes | 390 Views
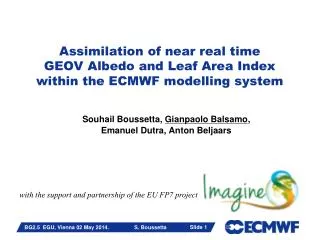
Assimilation of near real time GEOV Albedo and Leaf Area Index within the ECMWF modelling system. Souhail Boussetta, Gianpaolo Balsamo , Emanuel Dutra, Anton Beljaars. with the support and partnership of the EU FP7 project. Why vegetation state is important?.

E N D
Assimilation of near real time GEOV Albedo and Leaf Area Indexwithin the ECMWF modelling system Souhail Boussetta, Gianpaolo Balsamo, Emanuel Dutra, Anton Beljaars with the support and partnership of the EU FP7 project BG2.5 EGU, Vienna 02 May 2014. S. Boussetta
Why vegetation state is important? • Vegetation was shown to be of critical importance under the NWP framework: • Evapotranspiration • Boundary layer developement • Cloud and precipitation ... • Vegetation directly affect the global carbon cycle • Earth System Models are evolvingto better represent vegetationdynamic • Satelliteobservationswithchannelsinformative on the vegetation state are becoming more and more availableand with higheraccuracy & frequency • Assimilation of vegetation state productswould allow: • Better represent land biogenic fluxes in interaction with the atmosphere • Monitor present and past vegetation state anditsdynamics • Understand andadjustprocessdevelopmentwithinmodels • Ultimatelytoimproveweatherandearth systems prediction. BG2.5 EGU, Vienna 02 May 2014. S. Boussetta
How vegetation state is take into account? The data: The Copernicus GEOV1 LAI/albedo product is based on observations from the VEGETATION sensor on board of SPOT satellite. Global coverage with 1km / 10 day space/time resolution Produced in the framework of the Copernicus Initial Operation &IMAGINES and Freely available. The model: The ECMWF LSM (CTESSEL) coupled within the Integrated Forecasting system IFS var clim • The analysis system: • The analysis procedure is an optimal combination of the satellite observations and derived climatology, depending on their associated errors σo and σc. • Suitable for NWP framework and consistent with actual method used for slow evolving variables. Analysed trajectory obs t where BG2.5 EGU, Vienna 02 May 2014. S. Boussetta
Climatology(a-priori) Observation Vegetation state initialization GEOV1 LAI/Alb GEOV1 LAI/Alb Quality control + sf (albedo) Quality control + sf (albedo) 9-point Spatial smoothing 9-point Spatial smoothing Averaging => Gapped Climatology GEOV1 Observation + so Extraction of 10-day look-up table on land use type Analysis Temporal Gap filling Spatial Gap filling GEOV1 Climatology + sc GEOV1 Analysis BG2.5 EGU, Vienna 02 May 2014. S. Boussetta
In which cases vegetation matters most? Russian 2010 Heat wave Albedo anomaly LAI anomaly Horn of Africa 2010 drought Australia drought recover also visible in albedo Europe East China 2003droughts • NRT analysed LAI seems able to detect/monitor anomalous year • The analysed LAI and albedo signal appear to be covariant mainly during wet year. BG2.5 EGU, Vienna 02 May 2014. S. Boussetta
Which processes are affected by vegetation state? • The surface-only simulation setup: • To seek the impact of the NRT analysed data four experiments are performed • Period: 1999 to 2012 Coverage: Global Resolution: 40km • 4 different experiments: • Control: LAI+albedo climatology are used • NRT_ALB_LAI: LAI nrt data + albedo nrt • NRT_LAI: LAI nrt data + albedo climatology • NRT_ALB: LAI climatology + albedo nrt • Results evaluated on surface fluxes: • Latent heat flux • Sensible Heat flux • Carbon dioxide flux (Net Ecosystem Exchange of COt) BG2.5 EGU, Vienna 02 May 2014. S. Boussetta
Latent heat flux sensitivity NRT_ALB_LAI - Clim Clim NRT_ALB - Clim NRT_LAI - Clim BG2.5 EGU, Vienna 02 May 2014. S. Boussetta
Sensible heat flux sensitivity Clim NRT_ALB_LAI - Clim NRT_ALB - Clim NRT_LAI - Clim BG2.5 EGU, Vienna 02 May 2014. S. Boussetta
Carbon dioxide flux sensitivity Clim NRT_ALB_LAI - Clim NRT_ALB - Clim NRT_LAI - Clim BG2.5 EGU, Vienna 02 May 2014. S. Boussetta
Is weather affected by vegetation state? • The atmospheric coupled simulation setup: • To seek the impact of the NRT analysed data four coupled experiments are performed • Period: 2010 Coverage: Global Resolution: 40km • 4 different experiments: • Control: LAI+albedo climatology are used • NRT_LAI: LAI nrt data + albedo climatology • NRT_ALB: LAI climatology + albedo nrt • NRT_ALB_LAI: LAI nrt data + albedo nrt • Results evaluated on weather forecasts for next day : • 2m temperature (36-hour forecast range) • 2m relative humidity (36-hour forecast range) BG2.5 EGU, Vienna 02 May 2014. S. Boussetta
Is weather affected by vegetation state (II)? Horn of Africa drought & Australia drought recover The focus is on: • Check the T 2m and RH on short term forecast fc+36 valid 12 UTC, Nov. 2010 Sensitivity = (exp –ctl), if >0 =>warming/adding moisture, if <0 =>cooling/removing moisture And Impact = |ctl – analysis| - |exp – analysis| , if >0 => relative error reduction from the analysis (positive impact ) if <0 => relative error increase from the analysis (negative impact) Albedo anomaly LAI anomaly BG2.5 EGU, Vienna 02 May 2014. S. Boussetta
Weather forecasts sensitivity and impact Coupled run: NRT_LAI+ALB VsClim Sensitivity Impact Blue Better forecast Red Warming ΔT2m ΔErr T2m Blue Drying Blue Better forecast ΔRH2m ΔErr RH2m BG2.5 EGU, Vienna 02 May 2014. S. Boussetta
Conclusions & Outlook • The proposed analysis procedure leads to smooth temporal evolution of LAI/Albedo, which is more appropriate for initialization of environmental prediction models. • The analysed NRT LAI is able to detect/monitor anomalous year. • The analysed NRT albedo signal seems covariant with the NRT LAI mainly during wet year (compensation effect may occur between vegetation and bare-ground albedo). • GEOV1 NRT LAI/albedo showed potential for heat waves and drought monitoring but given the impact on energy and carbon fluxes these products are ECVs also for coupled experiments. • Introducing NRT LAI and Albedo in coupled runs is physically justified and has an overall neutral to positive impact on forecasted weather parameters, with the LAI signal being dominant and in some cases enhanced with the Albedo anomaly signal. • In future work, enhanced connections between albedo, LAI (and roughness) in Earth System Models will most likely increase the sensitivity to vegetation dynamics. BG2.5 EGU, Vienna 02 May 2014. S. Boussetta
Thank you for your attention http://fp7-imagines.eu/ Contact: souhail.boussetta@ecmwf.int BG2.5 EGU, Vienna 02 May 2014. S. Boussetta
Horn of Africa drought & Australia drought recover LAI anomaly Albedo anomaly BG2.5 EGU, Vienna 02 May 2014. S. Boussetta
Coupled run: NRT_LAI VsClim T2m Impact Sensitivity Yellow Warming Blue Positive impact Rh2m Blue drying Blue Positive impact BG2.5 EGU, Vienna 02 May 2014. S. Boussetta
Coupled run: NRT_ALB VsClim T2m Impact Sensitivity Rh2m BG2.5 EGU, Vienna 02 May 2014. S. Boussetta
2010 Russian Heat wave LAI anomaly Albedo anomaly BG2.5 EGU, Vienna 02 May 2014. S. Boussetta
Latent Heat flux Clim NRT_ALB_LAI - Clim NRT_ALB - Clim NRT_LAI - Clim BG2.5 EGU, Vienna 02 May 2014. S. Boussetta
Sensible Heat flux Clim NRT_ALB_LAI - Clim NRT_ALB - Clim NRT_LAI - Clim BG2.5 EGU, Vienna 02 May 2014. S. Boussetta
Net Ecosystem Exchange Clim NRT_ALB_LAI - Clim NRT_ALB - Clim NRT_LAI - Clim BG2.5 EGU, Vienna 02 May 2014. S. Boussetta
Assimilation of GEOV1 NRT LAI and its potential value (coupled runs) T2m Blue cooling Blue Positive impact RH Blue drying Blue Positive impact Scores of GEOV1 LAI NRT against GEOV1 LAI climatology for JJA: a) 2m temperature sensitivity [K], b) 2m temperature impact, c) 2m relative humidity sensitivity [%], d) 2m relative humidity impact. An overall neutral to positive impact. BG2.5 EGU, Vienna 02 May 2014. S. Boussetta
2003 Europe and East China drought LAI anomaly Albedo anomaly BG2.5 EGU, Vienna 02 May 2014. S. Boussetta
Latent Heat flux Clim NRT_ALB_LAI - Clim NRT_ALB - Clim NRT_LAI - Clim BG2.5 EGU, Vienna 02 May 2014. S. Boussetta
Sensible Heat flux Clim NRT_ALB_LAI - Clim NRT_ALB - Clim NRT_LAI - Clim BG2.5 EGU, Vienna 02 May 2014. S. Boussetta
Net Ecosystem Exchange Clim NRT_ALB_LAI - Clim NRT_ALB - Clim NRT_LAI - Clim BG2.5 EGU, Vienna 02 May 2014. S. Boussetta