Download
1 / 19

E N D
D-2-1 STELLAR CHARACTERISTICS OPTION D ASTROPHYSICS
STELLAR SPECTRA REVEALS COMPOSITION OF STARS Emission and absorption spectra occurring as electrons make transitions between energy levels. Such spectra provide important information about the chemical composition, density, surface temperature, rotational and translational velocities of stars. When we observe the spectrum of starsusing a spectrometer we find that nearly all stars show a continuous spectrum which is crossed by dark absorption lines; some stars also show bright emission lines. Seeing absorption lines across a continuous stellar spectrum tells us that the stars have a hot dense region(to produce the continuous spectrum) surrounded by cooler, low-density gas (to produce the absorption lines). In general, the density and temperature of a star decreases with distance from its center. Because its temperature is so high, a star’s corehas to be composed of high-pressure gases and not of molten rock, unlike the cores of some planets. It also implies that the transitions occur in agreement with the Balmer series from level n = 2 to higher levels. On the other hand, the Sun has some of the visible hydrogen lines. Because the Sun is cooler than Vega, many of its hydrogen atoms are in the ground state producing absorption lines that are in the ultraviolet region of the spectrum (corresponding to transitions from level n = 1 in the Lyman series). Stars that are even hotter than Vega tend not to produce hydrogen absorption lines in the visible spectrum because their high temperatures mean that the hydrogen in the photosphere is ionized (and therefore has no electron to become excited by the absorption of a photon).
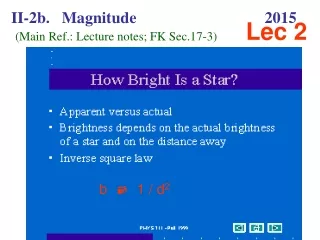
COMPOSITION OF STARS Absorption of certain wavelengths is apparent when we observe the intensity–wavelength relationship for stars. The smooth theoretical black-body curve is modified by absorption dips as can be seen in figure 1. The graph shows the variation with wavelength of the intensity for the Sun and Vega (which is much hotter than the Sun having a surface temperature of 9600 K). In the case of Vega, the cooler hydrogen in the star’s outer layers (the photosphere) absorbs the photons emitted by hydrogen. The clear pattern between the wavelengths absorbed and those of the visible part of the hydrogen absorption spectrum shown in figure 2 strongly suggests that Vega’s photosphere is almost entirely made up of hydrogen.
SPECTRAL CLASSES NATURE OF SCIENCE Stars were originally categorized in terms of the strength of the hydrogen absorption lines – with the stars producing the darkest absorption lines being called type A and those with successively weaker lines type B and C etc. Within the last century astronomers recognized that the line strength depended on temperature of the stars rather than their composition. Subsequently, the whole system of classification was revised with the result that many categories were abandoned and many others reordered – as shown in the table below. This form of star classification will not be included in your IB Diploma Programme Physics examinations, but is included here for historical interest and to indicate how many scientists have a reluctance to abandon a well-loved system!
WORKED EXAMPLE WORK EXAMPLE 1. (a) Explain the term black-body radiation. The diagram is a sketch graph of the blackbody radiation spectrum of a certain star. (b) Copy the graph and label its horizontal axis. (c) On your graph, sketch the black-body radiation spectrum for a star that has a lower surface temperature and lower apparent brightness than this star. (d) The star Betelgeuse in the Orion constellation emits radiation approximating to that emitted by a black-body radiator with a maximum intensity at a wavelength of 0.97 μm. Calculate the surface temperature of Betelgeuse. Show work here:
Stellar Parallax; Cepheid Variables STELLER DISTANCE * Cepheid Variables
CEPHEID VARIABLES *Characteristics • Cepheid Variables are luminous • Observable from Earth • The luminosity undergoes regular and predictable change in luminosity Cepheid variables are extremely luminous stars that undergo regular and predictable changes in luminosity. Because they are so luminous it means that very distant Cepheids can be observed from the Earth. In 1784, the periodic pulsation of the supergiant star, Delta Cephei, was discovered by the English amateur astronomer, John Goodricke. This star has a period of about 5.4 days
Cepheid Variables (a) Define (i) luminosity (ii) apparent brightness. (b) State the mechanism for the variation in the luminosity of the Cepheid variable. The variation with time t, of the apparent brightness b, of a Cepheid variable is shown. Two points in the cycle of the star have been marked A & B. (c) (i) Assuming that the surface temperature of the star stays constant, deduce whether the star has a larger radius after two days or after six days. (ii) Explain the importance of Cepheid variables for estimating distances to galaxies. (d) (i) The maximum luminosity of this Cepheid variable is 7.2 × 10 29 W. Use data from the graph to determine the distance of the Cepheid variable. (ii) Cepheids are sometimes referred to as “standard candles”. Explain what is meant by this. Worked example
Cepheid Variables (a) Define (i) luminosity (ii) apparent brightness. (b) State the mechanism for the variation in the luminosity of the Cepheid variable. The variation with time t, of the apparent brightness b, of a Cepheid variable is shown. Two points in the cycle of the star have been marked A & B. (c) (i) Assuming that the surface temperature of the star stays constant, deduce whether the star has a larger radius after two days or after six days. (ii) Explain the importance of Cepheid variables for estimating distances to galaxies. (d) (i) The maximum luminosity of this Cepheid variable is 7.2 × 10 29 W. Use data from the graph to determine the distance of the Cepheid variable. (ii) Cepheids are sometimes referred to as “standard candles”. Explain what is meant by this. Solution: Worked example
Hertzsprung-Russell (HR) Diagram * Main Sequence Main sequence stars are ordinary stars, like the Sun, that produce energy from the fusion of hydrogen and other light nuclei such as helium and carbon. Nearly 90% of all stars fit into this category. In the early 1900s, two astronomers, Ejnar Hertzsprung in Denmark and Henry Norris Russell in America, independently devised a pictorial way of illustrating the different types of star. By plotting a scattergram of the luminosities of stars against the stars’ temperatures, clear patterns emerged. These scattergrams are now known as Hertzsprung-Russell (HR) diagrams. In general, cooler red stars tend to be of relatively low luminosity, while hotter blue stars tend to be of high luminosity. With high temperature conventionally drawn to the left of the horizontal axis, the majority of stars create a diagonal stripe which goes from top left to bottom right – this is known as the main sequence. A small number of stars do not follow the main sequence pattern but, instead, form island groups above and below the main sequence. The vertical axis is commonly modified to show the ratios of star luminosity to that of the Sun (denoted as L ⊙ ) as shown in figure 6 – in this case the axis is logarithmic and has no unit. The temperature axis is also logarithmic and doubles with every division from right to left. The HR diagram shows the position of many stars of different ages; during the lifetime of a star its position will move on the diagram as its temperature and luminosity changes. We know from black-body radiation that the luminosity depends on the size of a star and its temperature. Small, cool stars will be dim and be positioned to the bottom right of the diagram – from Wien’s law we know they will be red. Large, hot stars will be of high luminosity and blue or blue-white in colour thus placing them at the top left of the diagram. A modification of the HR diagram to include the different star classes is shown in figure 7.
Hertzsprung-Russell (HR) Diagram * Main Sequence Red giants are cooler than the Sun and so emit less energy per square metre of surface. However, they have a higher luminosity, emitting up to 100 times more energy per second than the Sun. This means that they must have a much greater surface area to be able to emit such large energies. They, therefore, have a much larger diameter than the Sun – making them “giant” stars. Supergiant stars are gigantic and very bright. A supergiant emitting 100 000 times the energy per second and at the same temperature of the Sun must have a surface area 100 000 times larger. This leads to a diameter that is over 300 times the diameter of the Sun. Only about 1% of stars are giants and supergiants. White dwarfs are the remnants of old stars and constitute about 9% of all stars. Although they were very hot when they finally stopped producing energy, they have a relatively low luminosity showing them to have a small surface area. These very small, hot stars are very dense and take billions of years to cool down.