Download

1 / 57
570 likes | 709 Views
Economics 375. American Economic History Economic Growth. Readings. Passel and Attack, Chapter 1-American Economic Growth: A Long Run Perspective. Carlos M. Cipolla, The Economic History of World Population (website and RBR).

E N D
Economics 375 American Economic History Economic Growth
Readings. • Passel and Attack, Chapter 1-American Economic Growth: A Long Run Perspective. • Carlos M. Cipolla, The Economic History of World Population (website and RBR)
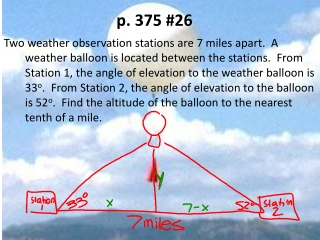
Putting U.S. Economic Performance and Growth in Perspective: The wider context. • Why is the United States a special place? • U.S. contains 4.23% of the world’s population and 7% of the land. • About 1 in 20 people in the world are Americans. • U.S. produces 24% of the world’s goods and services. • 1/20th of the world people produce 1/4th of the world’s goods and services. • The average American has an income 7.15 times more income than the average person in the rest of the world. • Only 9.1% of the world’s population has a per capita income above $10,000 ($5 per hour). • 2000 hours per year * $5/hr-=$10,000 • $200 per week. • What is the material condition of the majority of the world’s population today? • Look at poor areas of the world.—can you survive on $5 or 6 dollars week? • MRE • U.S. Military-Meal Ready to Eat. • $20 per day. • Requires less than $2 to provide a completely nutritious diet. • Diet consisting of some type of staple grain (rice, potatoes, wheat), cheap vegetables, and occasional animal protein can provide the RDA of all nutrients. • What are the long term effects on health due to a subsistence diet—modern medicine vs. Nutrition?
Consider the performance of the United States to other rich parts of the world, i.e. OECD countries. • Use purchasing power parity adjustment (PPP). • Compares the cost of a basket of goods in the U.S. and other countries and adjusts the price of goods so that $100 in U.S. dollars converted to currency of the other country and would be able to purchase the same basket of goods in both countries. • More suitable to comparisons between countries relatively close in income. • U.S. has a higher per capita income than any other industrialized country when a PPP adjustment is made. • Example cost of housing and gas in Europe, Japan, and the U.S.
The World We Live in---U.S. vs. Communist Countries, and the Pacific Rim. • Compared to Communist Countries, the U.S. is rich. • How did U.S. win the cold war? • The genius of Ronald Reagan. • Look at the size, population, and per capita income of Russia. • The U.S economy is 2.74 times larger than the Soviet Union. • Ronald Reagan figured out that if we spent 5% OF GNP on national defense. The USSR would have to spend 14% of GNP to match. • Compared to Pacific Rim Countries (except Japan), the U.S. is rich. • The theory pushed in the popular press prior to the Asian crisis, that the Pacific Rim countries were going to overtake the U.S. not supported by GNP numbers.
The world we live in --The U.S. over time. • U.S. has always been rich • The U.S. has experienced continuous steady economic growth. • Most communist countries have not achieved the GNP per capita enjoyed by the average American living in 1930. • Many 3rd world countries have not achieved the standard of living enjoyed by the average American in 1710.
Look at 2nd Primary Measure of Well Being: :Life Expectancy • Life Expectancy at birth in U.S. 75.9 years. • What are the two most dangerous periods of a person’s life? • First year and adolescence. • Childhood diseases and driving. • Life Expectancy at 40 in U.S. is 84 years. • Practical Value of this knowledge? • How does the U.S. compare to other developed countries? • Why do people in Japan and Hong Kong live longer than in U.S. • U.S. in the middle of developed countries mainly because we are too rich, i.e. too many fatty foods (red meat) and cigarettes and lack of exercise. • Life Expectancy in U.S. around 1776 less than 39 years. • Tremendous increase in life expectancy. • Causes and control? • Modern Medicine or Nutrition?
Related Measures: • Relationship Life Expectancy, crude birth rate (CBR), crude death rate (CDR), and infant mortality. • Interaction of CBR, CDR, ad infant mortality at each age determines life expectancy and population growth. • The demographic characteristics of the U.S. • The poorer the country the higher the CBR. • Babies as an inferior good? • Economic growth—the world’s greatest method of birth control? • Modern contraception in 3rd world countries. • China’s one baby policy. • The poorer the country the higher the CDR and infant mortality rate. • Death as an inferior good? • Modern Medicine vs. Nutrition? • Allocation of scarce resources. • With a limited amount of money, what is the most efficient way of increasing life expectancy in poor countries? • Look at U.S. Fertility Rate. • U.S. 2 children per woman, In 1800-8 children. Look at 3rd world countries. • Cause of the reduction in fertility? • Modern birth control?
The U.S. as a special place. • We are rich, have been rich, and are getting richer compared to the rest of the world. • Not only are we rich, been rich, and getting richer but we are living longer to enjoy our riches.
Carlo Cipolla. Prehistory to the Industrial Revolution. • World has developed through 3 stages. • Hunter/Gatherer Stage • People basically walked around and ate whatever they happened to come across. • Example of survivor training in air force. • Survival school is a 3 week course where the ultimate test is considered dropping a pilot into the wilderness and seeing if they can survive for one week with only a knife. • Minor technological advances-like stone knife, clothing, fire. dog. • Life Expectancy around 20 yrs. • Energy Budget probably around 4000 calories. • Required almost 100% of a persons time and energy merely to acquire basic food, clothing and shelter. • With the exception of the dog, relied on human muscle for power • World Population around 5-10 million around 10,000 B.C. • Population of southern California-25 million.
Agricultural Revolution-begun around 10,000 B.C. • Second stage of human development-The Agricultural Revolution. • Began to control the environment to produce animals and vegetables-sheep, goat, new plants, irrigation, wind (1-3.5 hp.) and water power. • Huge advance because instead of searching the forest to find food and shelter, you could produce it. • Concentrate the most desirable plants and animals in one place. • Reliance on animal converters of energy. • Horse, Mule, Oxen.-very inefficient converters of energy. • 10 to 1 rule conversion rule. • Harness and horseshoe. • Energy at most 10-1500 kcal/day--probably less than 10,000 in practice. • Simple surplus allowed the development of culture, literature, art, science, etc. World Population-1750-750 million, 1850-1200 million, 1950 2485 million. • Art, literature, culture, religion of the caveman?
Industrial Revolution • Industrial Revolution • Began around 1750 in Northern Europe. • European Economic History. • Rather than relying on animate converters of energy, man began to harness inanimate sources of energy. • Reliance on alternative sources of energy. • Water Power-Steam Turbine. • Steam engine-Coal. • Electricity-Water Power, Coal, Oil, Nuclear power. • Vast expansion in the energy available to men. • Enter the U.S. Look at how U.S. has improved over the last 250 years. • Per Capita Income 1710-550, 1775-750, 1840-2,650, 1945-10,450, 1960-11,100, 1991-22,550
Putting the U.S. growth experience in historical perspective. Insert Graph.
The U.S. Growth Experience: Some Preliminaries. • Possible Reasons for Economic Growth. • Increase in Factors of Production---more people, land, and machinery. • Increase in Productivity-Technology • How do we determine what proportion of growth is due to increase in factors of production and increases in productivity?
Economic Growth after 1840 • For economic historians, 1840 is the dividing year. • First year for which enough data exists to compute reliable GNP numbers. • Population, Agricultural and Manufacturing Census. • Manuscript vs. published volumes of the Census. • Over 120 years, from 1840 from 1960. • Small incremental increases accumulating over time. • U.S. economic growth the story of the small steady annual changes compounding over time. • The numbers • Population grew 2% per year • 10.5X growth 1840-1960. • Labor Force at 2.2%-implies increasing age of population • 13X growth. • If the labor force is growing faster than the population the age distribution of the population must be changing. • GNP at 3.6% • Per Capita Product at 1.6% • 6 X increase in productivity • Product per Worker at 1.4% • 5X increase.
Rates of Growth: Gross National Product, Population, Labor Force In the U.S., 1840-1960
How does this compare to other countries or how did the U.S. become a super power, i.e. large GNP. • Annual growth rate of population in U.S. much higher. • Immigration vs. Natural Increase. • Annual rates of growth of per capita income for US and for large European countries fall within a narrow range. • 1.9% for Russia, 1.2% for UK, 1.5%-1.6% for US, Japanese rate distinctly higher. • Not much difference between U.S. and other industrialized countries. • U.S. not exceptional in the growth rate of per capita income. • Higher growth of population and roughly the same rate of growth in per capita income caused a much higher growth in GNP. • Thus the rate of rise in GNP in the US was from a 1/5th to twice as high as other developed European countries. • The importance of population increase. • Natural increase vs. immigration.
How did the U.S. achieve high levels of per capita income? • High level of per capita income in the U.S was the result of an already high per capita income in 1840. • Importance of data issues. • Growth rate not exceptional compared to other countries, U.S. is exceptional only in that economic growth has occurred continuously over a much longer period. • Summary Statement: High US standard of living is the result of a long steady continuous growth in per capita output. It is not the result of any particular invention or government policy. • Depiction of economic growth in High School wrong. • The invention or revolution theory. • Example: cotton gin, light bulb telephone, etc. or govt. programs such as TVA or interstate highway system.
Population Growth • High rate of population growth due primarily to the power of this country to attract immigrants. • From 1840 to 1930, the population of the native stock grew from 14.2 mil to 82.7 mil.-6X increase. • The foreign born and native born of foreign or mixed heritage grew from 3 mil. to 40 mil.-a 13x increase. • In 1930, 1/3rd of the total pop. was of foreign stock.
Rate of Growth and Per Capita Income for Selected Countries for Long Periods.
Production Functions and Components of Economic Growth • If we want to understand how economic growth occurred, we can divide possible explanations into categories. • More inputs to the production process. • Better technology. • How do we decompose economic growth and make a statement about the relative contribution of more productive inputs and better technology? • For instance, how can we make a statement such as 80% of U.S. economics growth was due to better technology and 20% was due to more inputs. • Economic Historians frequently wish to measure differences in output that cannot be explained by differences in the quantity of productive inputs employed. • We solve this problem using a productivity index.
Productivity Indexes • If only one factor of production is used the notion of a factor productivity index is conceptually simple. • Thus if output W grown with only one input land R an index of land productivity can be constructed by comparing the output to input ratio. • Land that produces twice as much output is twice as productive. • Consider person who has a 1 acre farm and produces 1 bushel of corn. If 10 years later, he produces 2 bushels of corn on the same acre, then he is twice as productive.
Two Input Productivity Index • The construction of a productivity index becomes more complicated when there are multiple inputs to the production process. • Suppose however that two inputs are used Land-(R) and Labor (L) are used to cultivate carrots. Intuitively one wants to measure productivity by comparing carrot output with some combined measure or index (I) of the two factors of production. • The Index (I) presents a conceptual problem----I must be a single number which summarizes the changes in more than one input.
Two Input Productivity Index (2) • This still leaves the problem of how to choose a way to combine the two factors into the index of factors. • By definition the index must make it possible to compare disproportionate bundles of factors-say 7 units of land and 3 units of labor with 6 units of land and 4 units of labor. • If for example in a given year, 7 units of land and 3 units of labor produce 25% more carrots than 6 units of land and 4 units of labor the index value (I) should be 25 % greater than the index value of 6 land plus 4 labor.
Two Input Productivity Index (3) • Hence, I is constructed from reasonable assumptions about the way factor inputs combine under standard production conditions to make output. where a and b are geometric weights (add up to 1) • This provides a mathematical structure for the index but it doesn’t provide much help about the specific numerical weights a and b. • It turns out that factor shares in total output serve as proxies for a and b. • A factors share is defined as the proportion of the total cost of production is attributable to a single factor. • For instance, if laborers receive 70% of the carrots as their wages and landowners receive 30% as rent, a=.3 and b=.7.
Two Input Productivity Index (3) • An index based on geometric weights is particularly easy to manipulate mathematically since: • It follows that: • Where * indicates percentage change. • Thus the percentage change in total factor productivity simply equals the observed change in output minus the percent change in factors multiplied times their respective factor shares.
Total Factor Productivity Exercise. Suppose the data from the Year 1 and Year 2 census is given below. How much of the increase in output is due to increased productivity and how much is due to more inputs?
Total Factor Productivity Exercise. Suppose the data from the 1850 and 1950 census is given below. How much of the increase in output is due to increased productivity and how much is due to more inputs?
Total Factor Productivity Exercise. Suppose the data from the 1850 and 1950 census is given below. How much of the increase in output is due to increased productivity and how much is due to more inputs?
TFP Exercise (2) There was a 15x increase in inputs from 1850 to 1950. Increase in labor weighted more heavily because labor costs constitute a greater proportion of total costs than land costs. Output increased 27X, inputs increased 15x, productivity was responsible for a 11x increase in output. Productivity increases were responsible for 11/27th of the increase in output or 40% of the increase in output.
American Economic Growth: 1840-1960 • Increase in factors of production. • Population • Grew over 10 times-leading to increase in economic growth-but output grew by more than 60 times. • Labor force grew from 5.5 mil. in 1840 to 49 mil. in 1930 to 79 mil. in 1960 • Increase in quality of labor-immigration. • Capital • 27 bil in 1869 to 306 bil. to 1929, 442 bil. in 1955 to • per capita increase from $700 to $2500 to $2700 • per worker increase from $2000 to $6330 to $6740 • Output per unit of labor input increased faster than output per unit of capital input i.e. capital intensity of production was increasing.
Sources of Economic Growth; 1840-1960 • Productivity has grown at a steady and increasing rate since the beginning of the 19th century. • Productivity increased by a factor of 4X from 1869 to 1959. • In the 20th century productivity growth has accelerated. • to 1855, TFP grew by .3%. • to 1905, TFP grew by .5% • to 1927, TFP grew by 1.5% • to 1960, TFP grew by 1.9%
Period Labor Capital Land NNP 1840-60 3.42 6.57 3.73 4.75 1870-1930 2.24 4.35 2.55 3.75 1940-1990 1.56 3.14 .34 3.22 Percent of Growth Attributable to: Productivity 1840-60 .49 .26 .10 .15 1870-1930 .43 .27 .04 .27 1940-1990 .41 .14 0 .45 The Role of Productivity • Increase in Productive factors. • Labor increased 13 times and resource input increased 11.5 times. Capital input grew the most-almost a 100 times. • Increase in productivity comprised roughly 1/3rd the increase in output. The other 2/3rds came from increases in the quantities of labor and capital used. • Existence of Speedup after 1930.
Lessons from U.S. Economic Growth Experience • Growth in the United States is the result of a combination of factors. • A political system which attracts high quality inputs (labor) from other parts of the world. • A political system which has brought more land under it's purview. • A legal and political system encourages the accumulation of capital and the accretion of new knowledge and the discovery and implementation of improved methods of production. • Strong Private Property Rights. • Read parts 5 and 6 in Paul Johnson. • Quantitative analysis of U.S. shows that the increase in inputs was paramount in the early stages of economic growth. Simple increase in people, land, and capital were the primary factors creating growth until 1930. • More people with more land and capital to work with produced more output per person. • After 1930, increase in productivity became important. • In a sense, there was nothing magical about U.S. economic growth. It is the simple story of a system or market exchange and private property rights harnessing the forces of self interest over a long period of time. There is no magic bullet.
Foreign Aid and lessons for the World. • U.S. history suggests the way to create economic growth is to have a stable political and economic system which protects private property rights and to not interfere with the operation of the market. • Debilitating effect of warfare that disrupts voluntary exchange—most areas of the world that experience mass starvation are areas where voluntary exchange or the operation of the market has been disrupted. • Higher population and population density does not preclude economic growth and may, in fact, be a prerequisite or enabler of modern economic growth. • Economies of scale and the benefits of specialization according to comparative advantage. • Adopt the correct economic system and allow market forces to operate. During most of U.S. history there was no central planning or central direction to the economy. The market was simply allowed to operate. • All modern economies that have experienced significant economic growth have adopted U.S/Western European style capitalist economic systems.
The sorry history of U.S. international aid efforts. • In the post World War II era, i.e. the Kennedy administration, the U.S. and to a lesser extent Western Europe got into the business of “helping 3rd World countries to develop.” • Income redistribution from U.S. taxpayers to foreign governments. • Unfortunately instead of practicing good science, i.e. studying the U.S. growth experience and trying to recreate it in other parts of the world, Kennedy hired "The Best and the Brightest." • McNamara, the Vietnam War, Eisenhower and French Indochina, etc. • Recreational Reading: The Best and the Brightest by David Halberstam. • Also read, Johnson Part Eight. • Take-off Theories of Economic Growth and the U.S. experience before 1840. • Looking for justification for spending U.S. taxpayer money, the "Best and the Brightest" hooked onto the "Take Off Theory of Economic Growth.“ • Harvard professor-Walt Rostow. • In retrospect, it was just another example of a "stage theory of economic growth" aka Marxism. -Feudal, Capitalist, Communist. • Idea was that prior to 1840, U.S. per capita income had vacillated up and down with no clear trend. Somehow in the 1840's U.S. per capita income increased above some magic line and then took off. • Basic idea was that at low levels of per capita income, e.g. those experienced in India, Bangladesh, Central Africa, etc., people were stuck in the mud. Too poor to begin accumulating land, capital, etc. • There was mythical level of income above which people would enter a path of self sustaining economic growth would occur.
The sorry history of U.S. international aid efforts (2). • Problem with the take off theories of economic growth was that there was no evidence that a take-off had ever occurred in the U.S. or any other country. • Data problems with the census had precluded computing reliable GNP numbers prior to 1840. • Billions were spent without testing the basic underlying premise. • Parallel with famine alleviation efforts. • Effect of flooding market with free food on incentives to produce food locally. • Creation of a permanent state of dependence on U.N. aka U.S. charity. • Conspiracy theories.
Economic Growth before 1840. • In 1790, the U.S. was a relatively prosperous but fundamentally underdeveloped economy supporting a population of under 4 mil. confined to a few hundred mile band of farmland from ME to GA. • Everyone worked the land or provided processing and commercial services to those who did. • By 1860, 70 years later • Population was 31 million. • Experienced a far higher standard of living, • Settlement extended for over a thousand miles, well past the Mississippi river. • Agriculture supplemented by a booming manufacturing sector. • Economic historians have been preoccupied with the US before 1840 because they want to know the preconditions for sustained economic growth. • Can we explain the pace and pattern of this economic growth?
Data Problems. • Economic historians searching for evidence on growth rates before 1840 are forced to play archeologist. After that date, reliable estimates of national and regional output can be assembled. But evidence from earlier years is so scanty, reliable estimates cannot be assembled. • Before 1967, the conventional wisdom went, “ After 1790, the American economy prospered mightily as a result of the trade boom of the Napoleonic war era. Then the withdrawal of the US from world trade due to president Jefferson’s decision to suspend commerce produced a sharp drop in per capita income after 1807. • A early study by Robert Martin, suggested per capita income continued to decline for almost three decades, bottoming out in the 1830’s and then commencing a period of sustained rapid growth. • His methodology was questioned by Simon Kuznets, William Parker, and Frank Whartenby. but noone totally bought Kuznets speculation that per capita income might actually have risen during the period. • Marvin Towne and Wayne Rasmussen argue that rapid agricultural expansion represented a serious drag on labor productivity in the dominant sector of the economy. The country grew due to rapid population growth, but farmers facing depleted soils were barely able to maintain their standard of living. • Douglas North argued that the collapse of trade due to the Napoleonic War decreased the standard of living.
Data Problems (2) • All of these researchers agree that the puzzle of US economic Growth is the sharp discontinuity in the growth process in the 1830’s and 40’s • Rostow’s Theory: A long period of ups and downs without clear progress gave way to another developmental stage: sustained growth that more than doubled per capita income in 60 years and six fold in 120 years. • The great puzzle for a generation of developmental economists was: what happened to in the 1830’s and 1840’s that precipitated the leap to modern growth.
Paul David’s Research • Rather than measure per capita output directly from inadequate data, David makes use of simple arithmetic identities as a frame work for careful conjectures. • David makes use of the simple accounting identity:
Paul David’s Research (2) • If the value of each parameter were known for each date. it would be easy to calculate output per capita (V), or an index of per capita output for each date (t). • However, Pn is not known for dates before 1840. The census did not record output outside of agriculture before 1840. • Hence David assumes that the ratio of output per capita in the two sectors (Z) remained constant during the entire 1880/1840 period. • If the non-agricultural sector is small throughout the period, changes in Pn will have little overall effect on the per capita output measures.
Paul David’s Research (2) • Note that if Z is constant for all periods, the index of output per worker in each of the two sectors must be equal.
Paul David’s Research (2) • The Productivity index thus depends only on the values of the index of labor force participation (rt/ro), the agricultural productivity index (Pa/Pa) , the value in each period of Sa (the fraction of the labor force in agriculture), and the parameter of relative labor productivity (Z).
Paul David’s Results Note: Z is assumed constant from 1800 to 1860