Teaching structured analysis and design by adapting UML notation
Teaching structured analysis and design by adapting UML notation. Dave W Farthing & Gaylor Boobyer University of Glamorgan, UK Dr Paul Beynon-Davies University of Wales, Swansea, UK. Background.


Teaching structured analysis and design by adapting UML notation
E N D
Presentation Transcript
Teaching structured analysis and design by adapting UML notation Dave W Farthing & Gaylor BoobyerUniversity of Glamorgan, UK Dr Paul Beynon-Davies University of Wales, Swansea, UK © 2005, University of Glamorgan
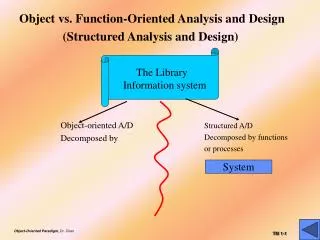
Background • BSc Computing degree students at the University of Glamorgan are taught analysis and design in two ways during their first two years. • First year - structured analysis and design techniques • traditionally using BSD (formerly SSADM). • Second year - object-oriented analysis and design techniques • using UML. © 2005, University of Glamorgan
Rationale • 1. Structured analysis and design: • techniques provide useful thinking tools; • paradigm is still widely used in industry; • outputs relate directly to implementation. • 2. Object-oriented analysis and design: • can avoid certain problems with structured; • paradigm is of growing importance; • used in subsequent years for advanced databases, oo systems and oo programming. © 2005, University of Glamorgan
What we did… and didn’t do For reasons I’ll explain in a moment… • Replaced some traditional BSD (SSADM) diagram notation in the first year module with notation that is similar to UML: • adapting the notation in the process; • solely for teaching purposes. • Not tried to squeeze structured analysis and design into an object-oriented paradigm or redefine UML. • No object-orientation taught in this module. © 2005, University of Glamorgan
The problems • Students were uncomfortable with two sets of notation. • The BSD technique Entity Life History uses a notation that is difficult to learn; • students focus on getting the notation right, rather than drawing something meaningful. • The BSD technique Logical Data Structure does not express cardinality and participation orthogonally (next slide). © 2005, University of Glamorgan
The problems • BSD technique LDS doesn’t express cardinality and participation orthogonally Customer Participation (optionality) Cardinality Upper end relates to Sales Order Upper end relates to Customer (Dotted line means a Customer may have no Sales Orders.) Lower end relates to Customer Lower end relates to Sales Order (Crow’s foot means a Customer may have many Sales Orders) Sales Order © 2005, University of Glamorgan
Our solutions • Try to use one set of notation as far as is practicable. • Replace the BSD technique Entity Life History with an easier notation. • Replace the BSD Logical Data Structure with a notation that expresses cardinality and participation orthogonally. © 2005, University of Glamorgan
Techniques taught • Use Case Diagram • Entity Relationship Diagram (LDS) • Entity Event Matrix • Activity Diagrams (ELH) • Data Flow Diagrams © 2005, University of Glamorgan
Techniques taught • Use Case Diagram • Entity Relationship Diagram (LDS) • Entity Event Matrix • Activity Diagrams (ELH) • Data Flow Diagrams. We’ll focus on these three. © 2005, University of Glamorgan
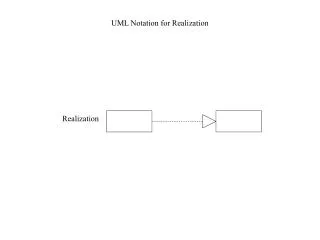
Entity Relationship Diagram • It has long been recognised that the structured concept of an entity is a similar concept to an object-oriented concept of a class • for example, see Chapter 10 of Beynon-Davies (1996) • Cardinality and participation can be expressed using number ranges, as in a UML Class Diagram: • aggregation and composition are not used so aren’t represented on the diagram; • generalisation is similar to an entity sub-type, so might be needed in more advanced case studies. © 2005, University of Glamorgan
Entity Relationship Diagram ERD using BSD notation (LDS) ERD using UML notation (adapted from Class Diagram.) Customer Customer 1..1 0..* Product Sales Order Product Sales Order 1..1 1..1 1..* Sales Order Line Sales Order Line 0..* © 2005, University of Glamorgan
Techniques taught • Use Case Diagram • Entity Relationship Diagram (LDS) • Entity Event Matrix • Activity Diagrams (ELH) • Data Flow Diagrams. We’ll focus on these three. © 2005, University of Glamorgan
Activity Diagram / ELH Diagram • The Jackson-like notation used by BSD is problematic for beginners: • rules about what types of boxes are permitted for “siblings”; • a simple enhancement can require an almost completely redrawn diagram. • UML’s Activity Diagram provides a simple flow-chart-like notation. • N.B. Similar to ELHs in SSADM Version 1! © 2005, University of Glamorgan
Activity Diagram / ELH Diagram ELH using BSD notation Purchase Order Line Raise purchase order Record delivery Record purchase invoice Archive/ delete Activity Diagram using UML notation. «entity» Purchase Order Line [today > DateInvoiced + 1year] Raise purchase order Record delivery Record purchase invoice Wait Archive/ delete © 2005, University of Glamorgan
ELH Diagram Purchase Order Line Raise purchase order Record delivery Record purchase invoice Archive/ delete ELH enhanced with ability to cancel an order Purchase Order Line Mid life Raise purchase order Archive/ delete Else Cancel Most CASE tools force the user to redraw much of the diagram simply to insert these two structure boxes. o o Process Cancel purchase order Record delivery Record purchase invoice © 2005, University of Glamorgan
Activity Diagram «entity» Purchase Order Line [today > DateInvoiced + 1year] Raise purchase order Record delivery Record purchase invoice Wait Archive/ delete AD enhanced with ability to cancel an order. «entity» Purchase Order Line [today > DateInvoiced + 1year] [else] Raise purchase order Record delivery Record purchase invoice Wait Archive/ delete Cancel purchase order [cancel] © 2005, University of Glamorgan
Activity Diagram • BSD’s operations added «entity» Purchase Order Line [today > DateInvoiced + 1year] [else] Raise purchase order Record delivery Record purchase invoice Wait Archive/ delete 7 8 9 10 11 12 13 1 2 3 4 5 14 6 Cancel purchase order [cancel] 1 Insert into Purchase Order Line • Tie to Purchase Order • Tie to Product Line • Set DateDelivered = null • Set DateInvoiced = null • Set remaining attributes • Set DateDelivered = today • Set DateInvoiced = today 9 Tie to Purchase Invoice • 0 Cut from Purchase Order • 1 Cut from Product Line • 2 Cut from Purchase Invoice • 3 Delete from Purchase Order Line • 4 Set CancelledFlag = null • 5 Set CancelledFlag = “Y”. 15 8 © 2005, University of Glamorgan
Techniques taught • Use Case Diagram • Entity Relationship Diagram (LDS) • Entity Event Matrix • Activity Diagrams (ELH) • Data Flow Diagrams. We’ll focus on these three. © 2005, University of Glamorgan
Data Flow Diagram • No equivalent in standard UML. • The Object Modeling Technique – which utilises UML – has a form of DFD, • unfortunately it isn’t ideally suited to business applications. • Since the DFD is a useful technique, widely used in industry and relatively easy to understand, the team decided to retain the standard BSD notation for DFDs. © 2005, University of Glamorgan
So what’s new? • Class diagram notation → ER Diagram • Similarities mentioned by many for several years. • A persistent class is stereotyped as <<entity>>. • Activity Diagram notation → ELH • A similar diagram appears in OMG’s UML 2.0 Superstructure Specification (next slide)… • Retained DFD • OMT has added a Data Flow Diagram. • If Rumbaugh can do it, why can’t I? • Brought together for teaching purposes. © 2005, University of Glamorgan
So what’s new? © 2005, University of Glamorgan
So what’s new? • Class diagram notation → ER Diagram • Similarities mentioned by many for several years. • A persistent class is stereotyped as <<entity>>. • Activity Diagram notation → ELH • A similar diagram appears in OMG’s UML 2.0 Superstructure Specification • Retained DFD • OMT has added a Data Flow Diagram. • If Rumbaugh can do it, why can’t I? • Brought together for teaching purposes. © 2005, University of Glamorgan
The problems Solved • Students were uncomfortable with two sets of notation. • Students now use essentially the same notation every year. • The BSD technique Entity Life History uses a notation that is difficult to learn. • Students can now focus on drawing something meaningful. • The BSD technique Logical Data Structure does not express cardinality and participation orthogonally. • UML’s notation does express cardinality and participation orthogonally. © 2005, University of Glamorgan
The results • Lecturers’ perspective: • Teaching the techniques was clear and simple; • we could concentrate more on how to solve case studies than how to represent a solution using the notation. • UML notation for participation and cardinality was particularly easy to explain; • previous confusion about which end of a line should be drawn using BSD’s dashed line was avoided. • Teaching Activity Diagram notation for entity life history diagrams was easy and effective; • students were able to focus on why the technique was needed rather than how to draw diagrams. © 2005, University of Glamorgan
The results • Students’ perspective: • (All 7 who failed in 2004 had failed every single module so discontinued their studies) • As often happens when staff introduce a novel teaching method, students did not have a published text book to refer to. © 2005, University of Glamorgan
Further work • Surveying students to identify the pros and cons of our approach. • This could provide quantitative and qualitative information to guide further work. • Looking at ways to derive DFDs objectively from an Entity Event Matrix. • It would then be possible to describe each DFD process in terms of the Activity Diagram operations on each entity. This would make the whole development process cohesive and facilitate detailed cross-checking. • Possibly developing a simple methodology that sets out a procedure for practitioners to follow. © 2005, University of Glamorgan
References • Beynon-Davies, P (1996) Database Systems, 1e (and subsequent editions). Macmillan. ISBN 0333636678 • OMG (2004) UML 2.0 Superstructure Specification. Object Management Group. • Rumbaugh, J (1996) OMT Insights. SIGS Books. ISBN 1884842585 • TSO (2000) Business Systems Development with SSADM. The Stationery Office. ISBN: 0113308833 . © 2005, University of Glamorgan