TEST SETUP FOR HF PMT AT IOWA LAB
260 likes | 436 Views
TEST SETUP FOR HF PMT AT IOWA LAB. CMS HCAL Meeting FNAL, November 16-18 Y. Onel U. of Iowa W. Anderson Iowa State U. D. Winn Fairfield U. Hardware and Software Tools for Test and Calibration of HF PMT.

TEST SETUP FOR HF PMT AT IOWA LAB
E N D
Presentation Transcript
TEST SETUP FOR HF PMT AT IOWA LAB CMS HCAL Meeting FNAL, November 16-18 Y. Onel U. of Iowa W. Anderson Iowa State U. D. Winn Fairfield U.
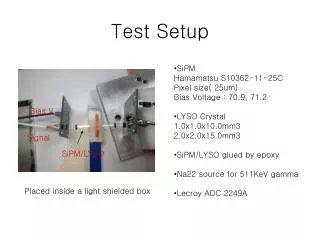
Hardware and Software Tools for Test and Calibration of HF PMT • The hardware system for the quality control of HF PMT at delivery will be installed at UI CMS lab. • Test Station Components: • 1 - Light sources: LASER, LED, Radioactive sources + Scintillators • 2 - Light-tight Test Box • 3 - Readout Electronics • 4 - Data Acquisition, Analysis and Storage PC - controlled System UI CMS HF Test Lab Electronics Light-tight Laser Bench Racks Test Box Scope 5 m PC Storage Cupboards 6 m
Tasks of the Test System: HF PMT Quality Control, Calibration and Monitoring System should address the following items: • label and catalogue each PMT at delivery and storage (StorageIN); • mechanical assembly with HV power supply and base; • installation in Test Box : individually or in groups (6 - 9); • measure: (a) - gain vs HV [G-HV] (b) - pulse shape [PS] (c) - single photoelectron response [SPR]; (d) - noise and dark current [N/DC]; (e) - photocathode uniformity [PCU]; (f) - linearity of response [LR]; (g) - pulse rate dependence [PRD]; (h) - quantum efficiency vs wave-length [QE-WL]; (i) - timing response and intrinsic delay [TR-D].
Procedures for measurements The following sequence of measurements will be performed for each PMT: 1 - PMT's installed in Test-Box are let to stabilize at standard HV; 2 - Check of normal operating conditions [source + scint.]; 3 - Noise and dark current measurements vs. HV; 4 - Gain vs. HV [laser]; 5 - Single photoelectron level; 6 - Linearity for 1- 2000 p.e.; 7 - Rate dependence for 0.1 - 40 Mz [LED]; 8 - Photocathode uniformity; 9 - Quantum efficiency (300-600 nm) [dye laser]; 10 - Pulse shape measurements at nominal HV. According to specifications of the PMT (manufacturer's data sheet and preliminary measurements on a test sample) and requirements of HF application (Nphe/GeV, dynamic range, etc.) the test setup working conditions will be adjusted in a range of light yield and sensitivity appropriate for the standard test procedure. Three light sources will be used for the specific measurements: - laser - LED - Rad. sources + radiator
The signal charge QA at the PMT anode for a pulse of Nph photons of w. l. l hitting the photocathode of quantum efficiency h(l) is: QA = G(V) h(l) Nph qe where G(V) is the PMT gain, h(l) Nph = Nphe is the number of photoelectrons (charge qe) at the cathode. For fixed illumination (<Nphe> = const.), the relation <QA> = A Vk determines k. At any voltage V, and fixed illumination (<Nphe> = const.), A is related to <QA>/<Nphe> qe DQA2/<QA>, where <Nphe > is estimated as <Nphe > = (1+d) (<QA>/DQA ) 2 [d 0 for pure Poisson photoelectron distribution, d 0.25 taking into account first dynode collection efficiency and SER]; DQA is the RMS spread (0.85 HWHM) of the anode charge QA distribution (see SER measurement). Measurements of gain vs HV can be performed with laser, LED, or source + radiator. The HV supply settings are stepped through the useful HV range for the PMT via computer control and pulse amplitude distribution measured with ADC. (a) Gain vs HV [G-HV]
(b) Pulse Shape [PS] The pulse shape (characterized by rise-time TR and FWHM of anode signals) is measured on a digital scope with PMT illuminated with a radiator and b-source. The digitized pulse shape is recorded.
(c) Single Photoelectron Response [SPR] The light yield is set to a low level, in such a way that there is no count in the majority of cases; for instance, with 80% missing counts, according to Poisson statistics, approximately 90% of the residual counts in these conditions, should correspond to single phe.
(d) Noise and Dark Current [N/DC] Dark current is measured at various HV settings with a picoamperometer, recorded with the PMT in stable temperature conditions and after a period ( 1/2 hour) in dark. Noise spectrum is obtained in same situations by measuring ADC pedestal spectrum, and subtracting the electronic noise contribution.
(e) Photocathode Uniformity [PCU] The uniformity of response for the photocathode is measured by having an illuminating spot (typ. 1mm diam.) spanning the photocathode surface (via a fiber moved with a scanning table) and recording pulse amplitude at each position.
(f) Linearity of Response [LR] The light yield on the photocathode is varied over a wide range and PMT response measured as a function of light intensity; various methods can be used to provide different light levels: calibrated filters, diaphragms, etc.; the variation of light yield is monitored with linear (photodiode) devices; the effective steps in illumination can be checked and adjusted at low light levels, using wide dynamic range ADC (or proper attenuation/amplification).
(g) Pulse Rate Dependence [PRD] The pulse rate dependence is measured with (a group of) LED (of equalized yield) mixed in a light manifold; over a certain range of pulse rates, the frequency of LED can be varied individually without change of the light pulse amplitude or duration; for higher frequencies few LED, feeding a light mixer, can be pulsed together, with short relative delays, thus producing a high frequency (defined by the delay) pulse train. Alternatively one LED can be pulsed for long times with an average light yield reproducing the amount of photons of a high frequency burst, and short pulses from another LED are analyzed as a function of the average current loadproduced by the first LED.
(h) Quantum Efficiency vs. Wavelength [QE-WL] The response of PMT is measured with definite WL of light (of known intensity).
(i) Timing Response and Intrinsic Delay [TR-D] The PMT is illuminated with radiator/scintillator excited with rad. source; the time response of the PMT and its transit time are measured with respect to a calibrated counter viewing the same light source.
Measurements will be performed at stable (controlled) temperature. For each delivery batch, sample measurements will be performed for temperature and magnetic field dependence. • The data for each PMT will be stored in appropriate archive files on disk and copied to permanent storage media. For each PMT an entry will be printed and logged to a general PMT directory and test logbooks.
The PMT's, conforming to acceptance criteria, will be sorted in classes and stored (Storage OUT), ready for installation. Those not conforming will be returned to the manufacturer. • All measurement procedures will be automated and computer-controlled, to minimize individual biases and interventions; daily test shifts will be supervised by an expert, who will also review the archived data of the day and certify their validity.
Electronics DAQ Pulsers & LASER, LED, Test Box Controls Trigger PC Logic TDC Data Storage Digital Scope Electronics The electronic system for the Test Setup includes: 1 - Pulsers for the Laser, LED and calibration pulses; 2 - Digital control circuits for - HV and LV power supplies, - Laser parameters and settings, - Stepping motors for moving parts in Test Box, - Probes for temperature, etc., in Test Box - Safety circuits on door, sliding mechanics, etc. 3 - Trigger logic for DAQ, monitors and gates 4- ADC and TDC for amplitude and timing measurements 5- Digital Oscilloscope for measuring and recording pulse shapes Electronics block diagram PMT's, Monitors, etc. PMT's, Monitors, etc.
Test Box The Test Box assembly consists of: 1 - PMT holder support with position remote control; 2 - Optical Manifold (O. M.) providing fiber coupling to individual PMT's and receiving light from: a - laser system with variable wavelength (dye), b - LED system pulsed at high frequencies, c - Radioactive sources + scintillators; 3 - Monitoring and control devices.
The Test Box is a light-tight and temperature-stabilized chamber [60 (H) x 60 (W) x 120 (L) cm3] containing precision remotely-controlled slides, supporting the PMT's holder and the assembly for O. M. and fibers coupling to the PMT's; it provides a number of sealed cable inlets and outlets for PMT signals, HV and LV and control signals as well as for fibers from the Laser system.
DAQ System and Measurement Strategy The following sequence of measurements will be performed for each PMT: 1 - PMT's installed in Test-Box are let to stabilize at standard HV; 2 - Check of normal operating conditions [source + scint.]; 3 - Noise and dark current measurements vs. HV; 4 - Gain vs. HV [laser]; 5 - Single photoelectron level; 6 - Linearity for 1- 2000 p.e.; 7 - Rate dependence for 0.1 - 40 MHz [LED]; 8 - Photocathode uniformity; 9 - Quantum efficiency (300-600 nm) [dye laser, source + scint.]; 10 - Pulse shape measurements at nominal HV.
Quality Assurance • At the manufacturer • testing/preselection as they arrive • beam/calibration tests during the installation period • we will eventually have two test stations for testing • PMT can be replaced • any PMT will function within 20% of any other PMT
Data Acquiaition System (DAQ) • We have VAx3200 (with backplane) which is a functional DAQ system with CAMAC • We have also purchased the interface cards and software for the mobile DAQ [which is LabView based] • We have U. of Iowa matching funds to purchase the components of the fixed PMT test station
UI U. Akgun A. Ayan P. Bruecken J.P. Merlo M. Miller Y. Onel I. Schmidt A. Tauke R. Vogel post-doc (to be named) ISU W. Anderson Fairfield U P. Winn International Team E. Gulmez Turkey A. Penzo Italy M. Zeyrek Turkey Manpower and expert team to install the test system
Test Team Post-doc (supervisor) M. Acar (graduate student) P. Bruecken (Quarknet lead teacher) A. Kocbay (graduate student) Bettendorf H.S. seniors (2) UI undergraduate (2)
Tests required of the vendor on each tube • Determine the cathode luminous sensitivity with a tungsten filament lamp with a color temperature of 2856K. • Determine the cathode blue sensitivity with a 2856K tungsten light filtered through a Corning CS5-58 filter ground to half stock thickness. 2a. Alternatively the vendor may measure and report the quantum efficiency of the tube at 420nm. • Determine the voltage at which a current gain of 5x10⁵ is reached. • Measure the dark current at a current gain of 5x10⁵.
Additional tests Our institution/university is interested in having additional selection tests performed at the vendor’s site. The vendor is invited to submit a proposal for PMTs with the following additional measurement made at the vendor’s site. The vendor shall determine the pulse height resolution at a gain of 5x10⁴ using the following method or some other method agreed on between the University and vendor. The PMT pulse height resolution shall deviate less then 30% from the ideal resolution (defined as sigma/mean equal to 1/sqrt(t) where Npe is the average number of photoelectrons produced by the photocathode for a given light pulse intensity) at a current gain of 5x10⁴. The vendor and University shall agree on an appropriate test to determine that this resolution specification is met.