Download
1 / 16
160 likes | 177 Views
This update provides an overview of the recent evolution and current status of the South American monsoon system, including rainfall patterns, climate highlights, and NCEP/GFS model forecasts.

E N D
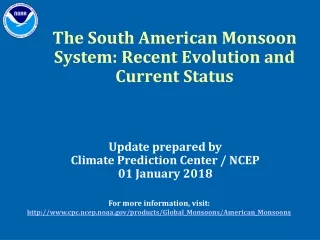
The South American Monsoon System: Recent Evolution and Current Status Update prepared by Climate Prediction Center / NCEP 01 January 2018 For more information, visit:http://www.cpc.ncep.noaa.gov/products/Global_Monsoons/American_Monsoons
Outline • Highlights • Recent Evolution and Current Conditions • NCEP/GFS Model Forecasts • Climatology
Highlights • Long-term rainfall deficits are present over the Brazilian Plateau. • During the last 7 days, below-average precipitation was observed over much of central Brazil, northeastern Argentina, Uruguay and northeastern Peru. Above-average precipitation was observed over portions of southern and northern Brazil, northern Bolivia and central Ecuador. • For Days 1-7 (01 - 07 Jan 2018), below-average precipitation is predicted over portions of northern Brazil, western Peru, western Bolivia and central Argentina. Above-average precipitation is predicted for portions of central and southern Brazil, Paraguay, eastern Bolivia, eastern Ecuador, northeastern Colombia and southern Chile.
Rainfall Total & Anomaly Patterns:Last 7 Days Total Anomaly During the last 7 days, below-average precipitation was observed over much of central Brazil, northeastern Argentina, Uruguay and northeastern Peru. Above-average precipitation was observed over portions of southern and northern Brazil, northern Bolivia and central Ecuador.
Rainfall Totals & Anomaly Patterns:Last 30 Days Total Anomaly During the last 30 days, below-average precipitation was observed over much of South America. Above-average precipitation was observed over scatted areas of northern Bolivia, Paraguay and southern Brazil.
BP Recent Evolution: RainfallLast 90 Days BP: Brazilian Plateau • 90-day rainfall deficits are present over the Brazilian Plateau (~ 100 mm).
Tropical Pacific and Atlantic SST Anomalies SSTs are below-average across the central and eastern tropical Pacific. (For details concerning El Niño – La Niña, go to the link below.) A weekly PowerPoint summarizing the ENSO Cycle: Recent Evolution, Current Status and Predictionsis available at: http://www.cpc.noaa.gov/products/precip/CWlink/MJO/enso.shtml
Atmospheric Circulation Recent 7 days • Upper panels: During the period of 24-30 Dec 2017, anomalous anticyclonic flow (center noted by red A) was observed southern Brazil. • Lower panels: Anomalous sinking motion was observed over east-central Brazil and northern Argentina. Anomalous rising motion was observed over southern Brazil and northwestern South America. A • Rising motion (negative omega, yellow/red shading), usually associated with wetter- than-normal conditions. • Sinking motion (positive omega, blue shading), usually associated with drier-than-normal conditions.
925-hPa Wind &Temperature Recent 30 Days Recent 7 Days During the 7-day period 24-30 Dec 2017, above-average temperatures were observed over eastern Brazil and southeastern Argentina. Low-level (~600 m above sea level) wind and temperature anomalies based on the NCEP Climate Data Assimilation Systems (CDAS) analysis. The patterns of anomalous temperature and wind at 925-hPa are usually similar to surface observations. Note: Areas with surface pressure below 925-hPa are masked out.
NCEP/GFS Model Forecasts Bias-Corrected Precipitation Forecasts from 01 January 2018–Days 1-7 Total Anomaly Note: Bias correction based on last 30-day forecast error.
NCEP/GFS Model Forecasts Bias-Corrected Precipitation Forecasts from 01 January 2018– Days 8-14 Total Anomaly Note: Bias correction based on last 30-day forecast error.
NCEP/GFS MODEL FORECASTS • For Days 1-7 (01 - 07 Jan 2018), below-average precipitation is predicted over portions of northern Brazil, western Peru, western Bolivia and central Argentina. Above-average precipitation is predicted for portions of central and southern Brazil, Paraguay, eastern Bolivia, eastern Ecuador, northeastern Colombia and southern Chile. • For Days 8-14 (08 - 14 Jan 2018), below-average precipitation is predicted over much of eastern Brazil, central Bolivia and southern Chile. Above-average precipitation is predicted over portions of western Brazil, northern Bolivia and Peru.
Forecast Verification Forecast from 18 Dec 2017 Valid for 25-31 Dec 2017 Forecast from 25 Dec 2017 Valid for 25-31 Dec 2017 Observed 25-31 Dec 2017
ClimatologyRainy Season Dates ONSET DEMISE