Download
1 / 1
10 likes | 134 Views
Overshoot in leaf area development in wet years leads to bark beetle outbreaks on fine-textured soils in drier years Wendy Peterman, PhD Conservation Biology Institute (wendy@consbio.org) Richard Waring , PhD Oregon State University ( richard.waring@oregonstate.edu). Discussion.

E N D
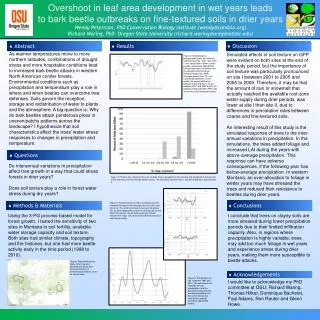
Overshoot in leaf area development in wet years leads to bark beetle outbreaks on fine-textured soils in drier years Wendy Peterman, PhD Conservation Biology Institute (wendy@consbio.org) Richard Waring, PhD Oregon State University (richard.waring@oregonstate.edu) Discussion Abstract Results As warmer temperatures move to more northern latitudes, combinations of drought stress and more hospitable conditions lead to increased bark beetle attacks in western North American conifer forests. Environmental conditions such as precipitation and temperature play a role in where and when beetles can overcome tree defenses. Soils govern the reception, storage and redistribution of water to plants and the atmosphere. A big question is: Why do bark beetles attack ponderosa pines in uneven/patchy patterns across the landscape? I hypothesize that soil characteristics affect the trees' water stress responses to changes in precipitation and temperature. Simulated effects of soil texture on GPP were evident on both sites at the end of the study period, but the importance of soil texture was particularly pronounced on site I between 2001 to 2005 and 2006 to 2009. Therefore, it may be that the amount of rain or snowmelt that actually reached the available root-zone water supply during drier periods, was lower at site I than site II, due to differences in percolation rates between coarse and fine-textured soils. An interesting result of this study is the simulated response of trees to the inter-annual variations in precipitation. In the simulations, the trees added foliage and increased LAI during the years with above-average precipitation. This response can have adverse consequences, if the following year has below-average precipitation. In western Montana, an over-allocation to foliage in wetter years may have stressed the trees and reduced their resistance to beetles during drier years. Figure 2. Modeled gross photosynthesis with four different soil textures (clay = blue, clay loam = red, sandy loam = green, sand = purple). Gray boxes highlight the time periods when soil texture has the greatest effect on Gross Primary Productivity (GPP). Changes greater than 10% are considered significant. In this graph, the percent difference between sand and clay is 14.3% between 2001 and 2005 and 11.5% between 2006 and 2009. GPP units are in tons of dry mass per hectare. Questions Do interannual variations in precipitation affect tree growth in a way that could stress forests in drier years? Does soil texture play a role in forest water stress during dry years? Figure 3. Percent clay content of the soils on both sites is grouped into five classes and compared to the percent of the total area of trees killed by beetle activity. The lined bars represent site I, and the dotted bars represent site II. Conclusions Methods & Materials Figure 4. Growth efficiency (GE) normalized over the modeled average for the time period for (A) site I and (B) site II. The solid lines show the annual simulated GE, and the dashed lines show the average GE for the entire time period. Values below average indicate reduced tree vigor. Gray boxes indicate time periods of high beetle activity. Using the 3-PG process-based model for forest growth, I tested the sensitivity of two sites in Montana to soil fertility, available water storage capacity and soil texture. Both sites had similar climate, topography and fire histories, but one had more beetle activity early in the time period (1998 to 2010). I conclude that trees on clayey soils are more stressed during lower precipitation periods due to their limited infiltration capacity. Also, in regions where precipitation is highly variable, trees may add too much foliage in wet years and experience stress during drier years, making them more susceptible to beetle attacks. Figure1. Map showing two study sites in western Montana with black dots showing locations of meteorological stations used for climate data. Acknowledgements Figure 5.Precipitation on site I between 1997 and 2010. The solid black line indicates annual precipitation, and the dashed line indicates the average precipitation for the entire time period. Gray boxes indicate periods of high beetle activity. I would like to acknowledge my PhD committee at OSU: Richard Waring, Thomas Hilker, Dominique Bachelet, Paul Adams, Ron Reuter and Glenn Howe.