Download
1 / 8
80 likes | 204 Views
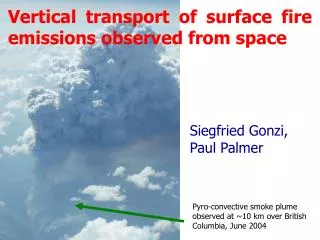
Vertical transport of surface fire emissions observed from space. Siegfried Gonzi, Paul Palmer. Motivation: The height of injection has implications for subsequent pollutant transport Complicated CFD problem We offer a new approach to estimate these heights using measurements of CO from space.

E N D
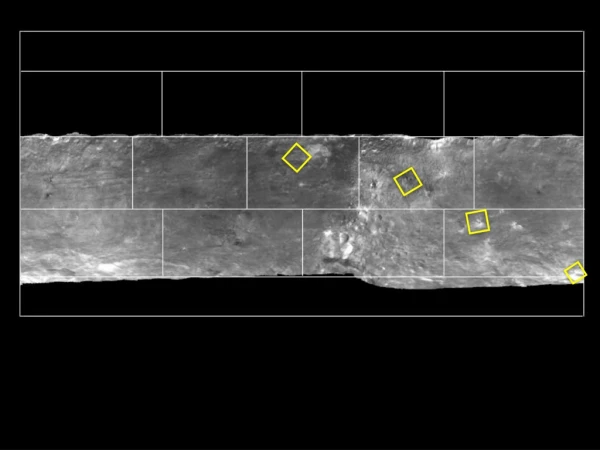
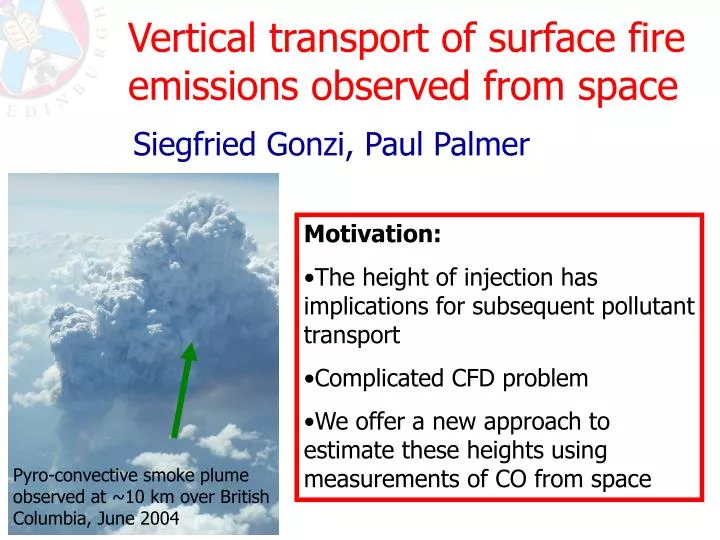
Vertical transport of surface fire emissions observed from space Siegfried Gonzi, Paul Palmer • Motivation: • The height of injection has implications for subsequent pollutant transport • Complicated CFD problem • We offer a new approach to estimate these heights using measurements of CO from space Pyro-convective smoke plume observed at ~10 km over British Columbia, June 2004
We use CO as a tracer for incomplete combustion We use cloud-free data from two instruments aboard the NASA Aura spacecraft (left): Tropospheric Emission Spectrometer (TES) Microwave Limb Sounder (MLS) Over burning scenes, together they are sensitive to changes in CO from the lower troposphere to the lower stratosphere: we get about 2-3 pieces of information.
We extend the traditional surface flux estimation problem Both sides describe the sensitivity of the measured quantity y to changes in surface emissions e Averaging kernel i = 1 … 5 mi = injected BB mass [kg CO] We estimate emitted CO mass m in five crude vertical state vector regions from 0–15 km.
Artificially inject mass into atmosphere over fires • 2ºx2.5º GEOS-Chem v7-04-10 driven by GEOS-4 meteorology • 8 day GFED v2 BB CO emissions • fossil + bioful emissions: standard GEOS-Chem inventory • prior BB mass injection in the tagged BB CO tracer 10% LS: 11-15km 22.5% FT: 8-11 km Altitude [km] 22.5% UFT: 5-8 km 22.5% LFT: BL – 5km 22.5% BL: 0 – BL km Injected mass % in vertical grid-boxes
(Limited) evaluation of our product: Indonesia, October 2006 • Definition injection height: • Posterior uncertainty is smaller than prior by 50% • Posterior mass is higher than the prior mass • 33% pass this criterion; remaining 67% assume boundary layer injection CALIPSO 2 = cloud
Gfedv2 CO [g CO/m2/JJASO] 2006 JJASO 1785 TES observations (672 colocated with MLS) Statistics of injection heights Gonzi, GEOS-Chem user meeting 2009
Tropics (0-30oS) Boreal (42-67oN) Disproportionate impact of large fires: Cptb - Cctrl Pressure [hPa] INDO Longitude [deg]
Concluding remarks • Inferred injection heights agree with GFED BB emissions within 10%. • Injections above the boundary layer are relatively rare (~20%) but result in disproportionate perturbations. • Case studies of injection heights over Siberia (July 2006) and over Indonesia (October 2006) agree well with independent observations.