Download
1 / 1
10 likes | 136 Views
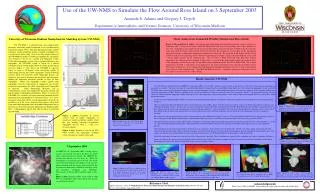
Use of the UW-NMS to Simulate the Flow Around Ross Island on 3 September 2003 Amanda S. Adams and Gregory J. Tripoli Department of Atmospheric and Oceanic Sciences, University of Wisconsin-Madison. Observations from Automated Weather Stations near Ross Island.

E N D
Use of the UW-NMS to Simulate the Flow Around Ross Island on 3 September 2003 Amanda S. Adams and Gregory J. Tripoli Department of Atmospheric and Oceanic Sciences, University of Wisconsin-Madison Observations from Automated Weather Stations near Ross Island University of Wisconsin-Madison Nonhydrostatic Modeling System (UW-NMS) Figure 4 (left) and Figure 5 (right): Meteograms from Willie Field and Cape Bird automated weather stations on 3 September 2003. Characteristics of the windward (Willie Field) and leeward (Cape Bird) sides of Ross Island were observed. (Cape Bird is not completely on the leeward side of Ross Island, but the lack of AWS on the leeward side, make Cape Bird the closest representation of the leeward side.) Ross Island has a local effect on the surrounding atmosphere which is evident in the temperatures and pressures observed. The tall peaks of Mt. Erebus and Mt. Terror on Ross Island provide a blocking to the stable flow approaching the island, causing a localized build up of mass and a locally higher pressure on the windward side. The pressures at Willie Field and Cape Bird were initially comparable, but while the pressure dropped at both stations as a result of the approaching cyclone, the localized effect of the topography caused the pressure at Cape Bird to drop significantly more than that at Willie Field. The warmer temperatures observed at Cape Bird can be explained by the stations proximity to the leeward side of Ross Island. The warmer temperatures can be explained by both adiabatic downsloping on the leeward side, as well as the damning of the cold air on the windward side. Cape Bird and Willie field show a significant temperature difference between the windward and leeward sides of Ross Island. The UW-NMS is a nonhydrostatic, quasi-compressible, enstrophy conserving model formulated in the non-Boussinesq framework (Tripoli, 1992). This three dimensional, fully scalable numerical weather prediction model is capable of multiple two-way interactive grid nesting. One of the truly unique features of the UW-NMS that makes it suitable for modeling the atmosphere over Antarctica is the use of a variable step topography system. Unlike other topography systems such as terrain following or step topography, the UW-NMS system is based on a surface coordinate step of variable depth, chosen to exactly match surface elevation (Figure 1). This allows the UW-NMS to represent slopes as steep as 90 degrees while also being capable of representing even the most subtle topography. Terrain following systems, while well suited for subtle topography changes, are limited to one vertical increment per horizontal grid increment, limiting the horizontal resolution possible in areas of steep topography. While step topography systems capture steep topography well, the requirement of stepping in one discrete vertical increment makes the subtle topography nearly impossible to represent. Finite differencing advection cast in vorticity/kinetic energy form and directly specifying vorticity and kinetic energy at topographical boundaries (Figure 2) ensures the UW-NMS of a vectorally consistent numerical treatment of flow interacting with topographical or structural barriers. As a result, competent simulations of flow around topographical obstacles are possible even in the severe Antarctic flow regimes, where both steep and subtle topography must be handled competently due to the presence of the Transantarctic Mountains low Froude number flow. A topographical dataset with 1km resolution is used with the UW-NMS. Results from the UW-NMS • The UW-NMS was initialized from the 0000UTC 3 September 2003 run of the GFS. Initially a series of three nested grids was used, then 12 hours into the simulation two more grids were added. The inner most grids were positioned specifically to capture the flow around Ross Island (Figure 6). The variable step topography system used in the UW-NMS does not restrict the horizontal resolution in areas of steep topography, and thus a high horizontal resolution was able to be applied with the innermost grid having a horizontal grid spacing of 500m. While the splitting of low level flow around Ross Island was captured by the course outer grids (Figure 7), the inner grids showcase the truly small scale influence that the topography of Ross Island has on the wind, temperature, and pressure patterns. Some of the unique meteorological features created by Ross Island are presented below: • As low level flow approached Ross Island it was unable to go over Ross Island, and thus slowed down, and created a localized area of high pressure on the windward side (Figure 7). • The near surface flow behaved differently on the eastern and western sides of Ross Island. The flow directed around the eastern side of Ross Island did not experience any additional topographic barriers. The flow that was directed around the western side of Ross Island interacted with Hut Point Peninsula and Cape Bird, causing the flow to be slower than around the eastern side and experience a vertical component (Figure 8). Notice on Figure 8 that the pressure change along the trajectories on the eastern side of Ross Island are due to the pressure gradient across the island, while the trajectories that flow around the western side of the island change pressure due to changes in elevation. • Ross Island is a tall enough barrier that it causes cold air damning on the windward side (Figure 11 and 12). The cold air builds in depth until it is deep enough to spill over between the peaks of Mt. Erebus and Mt. Terror. Underneath the damned-up cold air, a rotor like circulation develops as the air tries to go over Ross Island. • The downsloping on the leeward side of Ross Island is analogous to a hydraulic jump, and transports high momentum air from aloft down to the surface (Figures 11, 12, and 13). The downward transport of momentum is what allowed for fast low level flow to come out of the leeward side of Ross Island (Figure 9), an area of localized low pressure. • The downsloping on the leeward side produces localized areas of warming due to the adiabatic descent (Figure 10). Of note is the donut shaped warming located at the center of the leeward side of Ross Island. Vertical streamlines across Ross Island (Figure 11) show that the downsloping air does not immediately descend all the way to the surface, possibly due to an isolated pocket of cold air on the leeward side that is cut off from the flow due to the geometry of the leeward side. • Rotor like circulations develop on the leeward side of Ross Island due to Cape Bird. These circulations are depicted in the streamlines and vertical streamlines of Figure 9. • Small scale horizontal vortices are also created due to Ross Island and are visible in the surface streamlines (Figure 12) on the eastern leeward side of Ross Island and in Wohlschlag Bay between Mt. Erebus and Mt. Bird on the western side of Ross Island. Figure 8 (above): Grid 5 trajectories show the asymmetry to the flow as it splits around Ross Island (contours of pressure in 1mb increment). Figure 1(above): Depiction of various systems used to handle topography in numerical weather prediction models where the gray shading represents hypothetical topography that has both steep and subtle elevation changes. Figure 2(left): Zoomed in view of the UW-NMS variable step topography, including relative location of variables on the grid. Figure 6 (above): A series of five nested grids were used to model the flow around Ross Island on 3 September 2003. Figure 9(above): Grid 5 trajectories and streamlines are placed to illustrate the small scale circulations induced by Ross Island. 3 September 2003 At 0000UTC on 3 September 2003 a strong surface cyclone was located just off of the Ross Ice Shelf, with a central pressure of 962mb. By 1000UTC the cyclone had moved over the Ross Ice Shelf and intensified to a central pressure of 957mb. The winds created by the strong pressure gradient of the cyclone, when combined with the barrier wind created by the Transantarctic Mountains resulted in extremely windy and hazardous conditions near McMurdo. Observations at Ferrell AWS reported winds at 46.6 ms-1. Figure 7 (above): Grid 3 plot of surface pressure in 1mb increments demonstrates the local effect of Ross Island on the pressure field. Near surface trajectories (colored by speed), show the flow splitting around Ross Island. Figure 10 (above): Grid 4 surface temperature (oC) and streamlines show localized areas of warming on the leeward side of Black, White, and Ross Islands. Figure 11 (above): Grid 4 cross section (location of cross section shown in Figure 7) of streamlines and potential temperature illustrates the cold air damning on the windward side of Ross Island and downsloping between Mt. Erebus and Mt. Terror. Figure 12 (above): Grid 5 view from the north side of Ross Island showing the sfc streamlines and the 260K potential temperature surface shaded by speed (m/s). Figure 13(above): Grid 5 view of sfc streamlines. Trajectories (colored by pressure) illustrate that fast surface winds on the leeward side are from downsloping. Figure 3 (left): Infrared satellite image valid at 1800 UTC on 3 September 2003, shows the cyclone located over the Ross Ice Shelf. Reference Cited Acknowledgements Tripoli, Gregory J. 1992: A Nonhydrostatic Mesoscale Model Designed to Simulate Scale Interaction.Monthly Weather Review: Vol. 120, No. 7, pp. 1342–1359. Thank you to AWS and AMRC for providing the surface observations and satellite data.