Download
1 / 29
290 likes | 447 Views
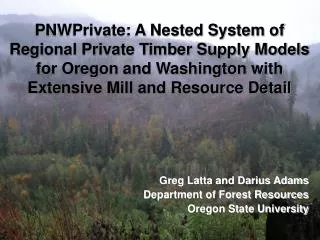
Simulated effects mandatory versus voluntary participation in private forest carbon offset markets in the United States. Gregory Latta, Darius Adams and Sara Ohrel Oregon State University and US Environmental Protection Agency. FASOM Model Collaborators . Texas A&M Bruce McCarl

E N D
Simulated effects mandatory versus voluntary participation in private forest carbon offset markets in the United States Gregory Latta, Darius Adams and Sara Ohrel Oregon State University and US Environmental Protection Agency
FASOM Model Collaborators • Texas A&M • Bruce McCarl • Jerry Cornforth • Nicholas Institute, Duke • Brian Murray • Justin Baker • Oregon State University • Eric White • USDA • Ralph Alig • William Hohenstein • Jan Lewandrowski • Rob Johansson • EPRI • Steven Rose • RTI International • Robert Beach
Modeling the Carbon Offset Market • Brief Overview of FASOM model • Recent carbon market developments • Regulatory (HR2454, S1733, RGGI, AB32) • Voluntary (CAR, VCS, ACR) • Modeling carbon markets in a voluntary context • Results from our first attempt • Issues and challenges in modeling a voluntary policy • Baseline, additionality and leakage • A second modeling attempt • Conclusion
FOREST AND AGRICULTURE SECTOR OPTIMIZATION MODEL with GREENHOUSE GASES (FASOM-GHG) LAND USE CHANGES FOREST SECTOR MARKETS AND FOREST LAND BASE: INVENTORY SILVICULTURAL REGIME ROTATION FOREST TYPE MANUFACTURING FLOWS OF FEEDSTOCKS FOR BIOENERGY AND ETHANOL AGRICULTURE SECTOR MARKETS AND AG LAND BASE: CROPPING TILLAGE METHODS LIVESTOCK ENERGY SECTOR FEEDSTOCK MARKETS
Elements of FASOM Forest Sector • COMMODITIES (ENDOGENOUS) • SOFTWOOD LUMBER, HARDWOOD LUMBER, SOFTWOOD PLYWOOD, OSB • PAPER PRODUCTS (14), MARKET PULP (4), RECYCLED • NATIONAL DEMAND FOR EACH COMMODITY • REGIONAL AND IMPORT SUPPLIES • PRODUCTION PROCESSES (PULP AND PAPER) • ALTERNATIVE FIBER MIXES • ALTERNATIVE TECHNOLOGIES (PULPING AND PRESSES) • TIMBER INVENTORY DATED FROM ca 2000 • TIMBER GROWTH • MANAGEMENT CLASSES (11 IN SOUTH, 5 IN PNWW, 2 ELSEWHERE) • FOREST TYPES (6 IN SOUTH, 3 IN PNWW, 2 ELSEWHERE) • PARTIAL CUTTING • SILVICULTURAL AND LAND CONVERSION COSTS
Policy BackgroundUS Greenhouse Gas Emissions From: (EPA 430-R-11-005) Inventory of U.S. Greenhouse Gas Emissions and Sinks:1990 – 2009 http://www.epa.gov/climatechange/emissions/downloads11/US-GHG-Inventory-2011-Complete_Report.pdf
The Emissions Cap Federal Regional (California) http://www.epa.gov/climatechange/economics/pdfs/EPA_S1733_Analysis.pdf http://www.arb.ca.gov/cc/capandtrade/meetings/121409/capcalc.xls
http://www.epa.gov/climatechange/downloads/s2191_EPA_Analysis.pdfhttp://www.epa.gov/climatechange/downloads/s2191_EPA_Analysis.pdf
The End Goal – Domestic offsets (FASOM) U.S. EPA, 2009. Updated Forestry and Agriculture Marginal Abatement Cost Curves. Memorandum to John Conti, EIA, March 31, 2009.
So How Can We Improve? • One Way is to: • Model Cap and Trade in a Voluntary Offset Context • Forest sector not “capped” • Sell offsets as carbon sequestered or emissions avoided
Modeling a Voluntary Carbon Offset Market • Make enrollment in the market Voluntary • Land in the model would have to “opt in” • Land that does not “opt in” will have no control on emissions levels (no penalty) • Require a 100 year commitment • Addresses permanence (makes model smaller as well) • Include harvested wood product carbon
Ever Increasing Marginal Cost Curve Notes: EPA 2005 = EPA, Greenhouse Gas Mitigation Potential in U.S. Forestry and Agriculture, November 2005. ERS 2004 = USDA, Economics of Sequestering Carbon in the U.S. Agricultural Sector, Apr. 2004. MS 2001 = Bruce A. McCarl and Uwe A. Schneider, “Greenhouse Gas Mitigation in U.S. Agriculture and Forestry,” Science, vol. 294 (December 21, 2001), pp. 2481–2482. R 1997 = Kenneth R. Richards, Estimating Costs of Carbon Sequestration for a United States Greenhouse Gas Policy (Boston: Charles River Associates, 1997). MR 1990 = Robert J. Moulton and Kenneth R. Richards, Costs of Sequestering Carbon Through Tree Planting and Forest Management in the United States, General Technical Report WO-58 (USDA, Forest Service, 1990). FROM: Estimates of Carbon Mitigation Potential from Agricultural and Forestry Activities Congressional Research Service, 7-5700, www.crs.gov, R40236
Land Movement Between Forest and Agriculture Negative value indicates net deforestation Positive value indicates net afforestation
First Modeling Attempt Conclusion • Modeling • We need to pay attention to model users needs • How we structure the policy in the model is important • Results • marginal cost curves of C are steeper in voluntary market--as some previous econometric studies have suggested • optional offset sales entry leads to fewer acres of afforestation and less response from management of existing forests • prices effects in traditional products markets are notable and exaggerated when C prices rise and are especially wide in a mandatory offset scheme Latta, G., D. Adams, R. Alig and E. White. 2011. Simulated effects of mandatory versus voluntary participation in private forest carbon offset markets in the United States. Journal Forest Economics 17(2): 127-141.
Issues and Challenges in modeling a voluntary policy • Baseline • In mandatory market model baseline doesn’t matter • In voluntary market model it does • Why? • Mandatory • Every change in carbon stocks will be accounted for in the optimization • Voluntary • Baseline drives the decision of whether you want changes in carbon stocks accounted for in the objective function. • Baseline is now important in policy effectiveness modeling
Issues and Challenges in modeling a voluntary policy A breakdown of the offset supply curve from Latta etal. 2011 by enrollment • First Thoughts • Given that • A is the quantity of offsets available • Annual flux on enrolled lands • And • B is the net forest sequestration • Annual flux on all lands • Therefore • C is the quantity of leakage • Annual flux on non-enrolled lands C B A
Issues and Challenges in modeling a voluntary policy A breakdown of the offset supply curve from Latta etal. 2011 by enrollment • Next Thoughts • Given that • A is the quantity of offsets available • Annual flux on enrolled lands • And • B is the net forest sequestration • Annual flux on all lands • Therefore • C is the quantity of non-additional CO2e • Annual flux on non-enrolled lands A C B
Issues and Challenges in modeling a voluntary policy Why low, or no leakage? • MoreThoughts • In the $0 run • there are Good Guys (land sequestering C) • and Bad Guys (land emitting C) • Given that it is a model based on optimality a small change in C price sorts out the good and bad guys • Given the policy design, you are paid (or pay) for your C flux at each point in time. • If you are a Bad Guy (opting out) • And want to be a Good guy (opt in) • You must improve your C flux all the way to zero before you begin to get paid. • Also, these are aggregate amounts • fewer “opt out” acres = more emissions per acre Good Guys Bad Guys Bad Guys Bad Guys Bad Guys Bad Guys Bad Guys Bad Guys Good Guys
A Second Modeling Attempt • Goals • Minimize additionality issues • Minimize leakage issues • Eliminate baseline • A simple effective policy • Methods • Use forest sector model only • Pay for only tree and harvested wood carbon • Above, but on existing forest only when past minimum harvest age (X) • Above, but only when past minimum harvest on existing and regenerated forests (XN)
Results With Forest Sector Only • Pay for only tree and harvested wood carbon • Above, but on existing forest only when past minimum harvest age • Above, but only when past minimum harvest on existing and regenerated forests
Results With Forest Sector OnlyFlux on existing stands only when greater than minimum harvest age Text here
Results With Forest Sector OnlyFlux only when greater than minimum harvest age Text here
Results With Forest Sector Only • C_Total – all forest accounts • C_In– Enrolled land only • FO – C payments for tree and HWP C only • X – no payments on existing stands unless > minimum harvest age • N - no payments on existing and regenerated stands unless > minimum harvest age
Conclusion • A third (future) modeling attempt? • Use what was learned prior runs and … • Relax permanence restriction • Use stocking level instead of age as qualifier • Combine with voluntary agriculture model