Download
1 / 16
160 likes | 350 Views
68%. 85 (mean - 1 SD) 115 (mean + 1 SD). About 68% of scores fall in the range of the mean plus and minus 1 SD; 95% in the range of the mean +/- 2 SDs; 99.7% in the range of the mean +/- 3 SDs. e.g. IQ is normally distributed (mean = 100, SD = 15).

E N D
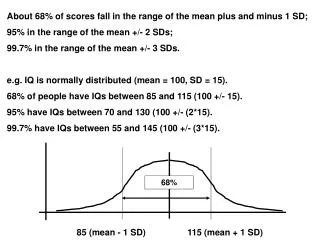
68% 85 (mean - 1 SD) 115 (mean + 1 SD) About 68% of scores fall in the range of the mean plus and minus 1 SD; 95% in the range of the mean +/- 2 SDs; 99.7% in the range of the mean +/- 3 SDs. e.g. IQ is normally distributed (mean = 100, SD = 15). 68% of people have IQs between 85 and 115 (100 +/- 15). 95% have IQs between 70 and 130 (100 +/- (2*15). 99.7% have IQs between 55 and 145 (100 +/- (3*15).
We can tell a lot about a population just from knowing the mean, SD, and that scores are normally distributed. If we encounter someone with a particular score, we can assess how they stand in relation to the rest of their group. e.g. someone with an IQ of 145 is quite unusual (3 SDs above the mean). IQs of 3 SDs or above occur in only 0.15% of the population [ (100-99.7) / 2 ].
z-scores: z-scores are "standard scores". A z-score states the position of a raw score in relation to the mean of the distribution, using the standard deviation as the unit of measurement. 1. Find the difference between a score and the mean of the set of scores. 2. Divide this difference by the SD (in order to assess how big it really is).
X = 236 z = 1.5 Raw score distributions: A score, X, is expressed in the original units of measurement: X = 65 z-score distribution: X is expressed in terms of its deviation from the mean (in SDs).
z-scores transform our original scores into scores with a mean of 0 and an SD of 1. Raw IQ scores (mean = 100, SD = 15) z for 100 = (100-100) / 15 = 0, z for 115 = (115-100) / 15 = 1, z for 70 = (70-100) / -2, etc. 55 70 85 100 115 130 145 raw: z-score: -3 -2 -1 0 +1 +2 +3
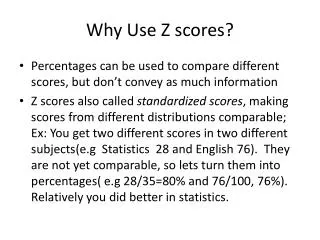
Why use z-scores? 1. z-scores make it easier to compare scores from distributions using different scales. e.g. two tests: Test A: Fred scores 78. Mean score = 70, SD = 8. Test B: Fred scores 78. Mean score = 66, SD = 6. Did Fred do better or worse on the second test?
Test A: as a z-score, z = (78-70) / 8 = 1.00 Test B: as a z-score , z = (78 - 66) / 6 = 2.00 Conclusion: Fred did much better on Test B.
2. z-scores enable us to determine the relationship between one score and the rest of the scores, using just one table for all normal distributions. e.g. If we have 480 scores, normally distributed with a mean of 60 and an SD of 8, how many would be 76 or above? (a) Graph the problem:
(b) Work out the z-score for 76: z = (X - X) / s = (76 - 60) / 8 = 16 / 8 = 2.00 (c) We need to know the size of the area beyond z (remember - the area under the Normal curve corresponds directly to the proportion of scores).
Many statistics books (and my website!) have z-score tables, giving us this information: (a) (b) * x 2 = 68% of scores + x 2 = 95% of scores # x 2 = 99.7% of scores (roughly!)
0.0228 (d) So: as a proportion of 1, 0.0228 of scores are likely to be 76 or more. As a percentage, = 2.28% As a number, 0.0228 * 480 = 10.94 scores.
How many scores would be 54 or less? Graph the problem: z = (X - X) / s = (54 - 60) / 8 = - 6 / 8 = - 0.75 Use table by ignoring the sign of z : “area beyond z” for 0.75 = 0.2266. Thus 22.7% of scores (109 scores) are 54 or less.
? 89 92 Word comprehension test scores: Normal no. correct: mean = 92, SD = 6 out of 100 Brain-damaged person's no. correct: 89 out of 100. Is this person's comprehension significantly impaired? Step 1: graph the problem: Step 2: convert 89 into a z-score: z = (89 - 92) / 6 = - 3 / 6 = - 0.5
? 89 92 Step 3: use the table to find the "area beyond z" for our z of - 0.5: Area beyond z = 0.3085 Conclusion: .31 (31%) of normal people are likely to have a comprehension score this low or lower.
Conclusions: Many psychological/biological properties are normally distributed. This is very important for statistical inference (extrapolating from samples to populations - more on this in later lectures...). z-scores provide a way of (a) comparing scores on different raw-score scales; (b) showing how a given score stands in relation to the overall set of scores.
Conclusions: The logic of z-scores underlies many statistical tests. 1. Scores are normally distributed around their mean. 2. Sample means are normally distributed around the population mean. 3. Differences between sample means are normally distributed around zero ("no difference"). We can exploit these phenomena in devising tests to help us decide whether or not an observed difference between sample means is due to chance.