先週: Br を考慮しても Andrei の最適化を再現できなかった。 今週: anti-DID の強さを変えてみて、同じ振る舞いをするか?
30 likes | 174 Views
先週までの事と今週の内容. 先週: Br を考慮しても Andrei の最適化を再現できなかった。 今週: anti-DID の強さを変えてみて、同じ振る舞いをするか?. Andrei のグラフ. 最大で 50% 超の pairs が extraction line を通り抜けていき、そのすぐ右側では通り抜ける割合が急激に悪くなるグラフを形成している。. 図 1 : Andrei の最適化. 再現シミュレーション. ・ anti-DID field に掛ける係数を変化させて Event を生成。 ・ z=430[cm] での monitor 。

先週: Br を考慮しても Andrei の最適化を再現できなかった。 今週: anti-DID の強さを変えてみて、同じ振る舞いをするか?
E N D
Presentation Transcript
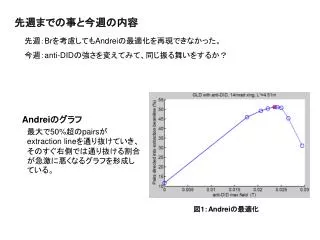
先週までの事と今週の内容 先週:Brを考慮してもAndreiの最適化を再現できなかった。 今週:anti-DIDの強さを変えてみて、同じ振る舞いをするか? Andreiのグラフ 最大で50%超のpairsがextraction lineを通り抜けていき、そのすぐ右側では通り抜ける割合が急激に悪くなるグラフを形成している。 図1:Andreiの最適化
再現シミュレーション ・anti-DID fieldに掛ける係数を変化させてEventを生成。 ・z=430[cm]でのmonitor。 ・pz>0はIPから外へ出る粒子を意味する。(pz<0は後方散乱を意味する) 表1:係数変化によるextraction beamlineに出る粒子の変化(一部抜粋)
図2:係数変化によるPairs directed into extraction beamlineの変化 ・約0.03[T]付近で最大となる。(Andreiは0.0236[T]付近) ・極大値の右側の振る舞いがAndreiのとは異なっている。 結果 Andreiの最適化図の右側の振る舞いが再現されそうにない。