Download
1 / 35
350 likes | 506 Views
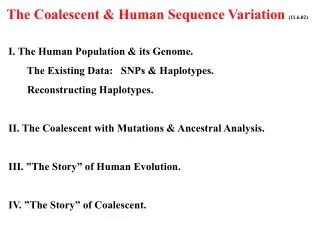
The Coalescent & Human Sequence Variation (11.6.02). I. The Human Population & its Genome. The Existing Data: SNPs & Haplotypes. Reconstructing Haplotypes. II. The Coalescent with Mutations & Ancestral Analysis. III. ”The Story” of Human Evolution.

E N D
The Coalescent & Human Sequence Variation (11.6.02) I. The Human Population & its Genome. The Existing Data: SNPs & Haplotypes. Reconstructing Haplotypes. II. The Coalescent with Mutations & Ancestral Analysis. III. ”The Story” of Human Evolution. IV. ”The Story” of Coalescent.
The Human Genomehttp://www.sanger.ac.uk/HGP/ 1 2 3 X 6 4 7 11 16 5 8 9 10 19 20 15 17 21 13 14 18 22 12 Y 3 billion base pairs per haploid genome 30.000-40.000 genes
Recent SNP/Haplotype Analysis. Inter.SNP Consortium (2001): A map of human genome sequence variation containing 1.42 million SNPs. Nature 409.928-33 For 2 complete haplotype genomes, there would be expected about 3 million SNP differences. The number of expected SNPs for more genomes should then grow as the expected number of segregating sites in an ideal population, i.e. approximately logarithmically.
Linkage disequilibrium in the human genome Reich,DE et al.(2001) Linkage disequilibrium in the human genome Nature 411.199-204 LD:=fi,j-fifj E(LD)=1/(1+4Ner) LD in europeans stretches 60kb, while in Yorubans much less.
Conclusions (258 chromosomes): Haplotypes better than SNPs. Genome spit up in blocks without recombination. Daly,JM et al.(2001) High-resolution haplotype structure in the human genome. Nat.Gen. 29.229-32.
A T C Haplotypes: 2m-1 A G C SNPs: {A,T} {C,G} {A,C} Egg & Sperm Sequencing Cell Lines with Lost Chromosomes Sequencing Clones Spanning SNPs SNPs & haplotypes: Getting Haplotypes Very expensive so reconstructing haplotypes from SNPs are favoured.
{N1,N2}n,1 {N1,N2}n,m SNPs --> haplotypes:Computational Problem 1 m {N1,N2}1,1 {N1,N2}1,m 1 n ? 1,1 {N1 or N2}1,1 {N1 or N2}1,m n,1 {N1 or N2}n,1 {N1 or N2}n,m
SNPs ---> haplotypes: Clark (1990) Algorithm: Find homozygotes or single heterozygotes & deduce existing haplotypes. Run through remaining SNPs and assign to expanding set of determined haplotypes. Check if unresolved haplotypes can be explained as recombination of resolved haplotypes.
H2 H5 H1 H4 H6 H3 H3 H4 H1 H2 SNPs ---> haplotypes: Clark (1990) Spanning Tree instead of phylogenetic tree assignment of haplotypes Spanning Tree: Phylogenetic Tree: Three Problems: No homozygote or single heterozygotes available The process leaves unresolved haplotypes A haplotype is declared a recombination between two existing haplotypes, although it exists in the sample.
SNPs ---> haplotypes: Gusfield (2002) Haplotype Inference: Make Phylogeny with 2n leaves exhausting the SNPs. Perfect Phylogeny: only 0 or 1 event at each site. A position in an individual is labelled 0 and 1 if homozygous for one of the two variants and labelled 2 if heterozygous. c’ 1 2 a 2 2 a’ 2 2 b 0 2 b 0 2 b’ 0 2 c 1 0 c’ 1 0 c a 1 2 a 1 0 a’ 0 1 b 0 1 b’ 0 0 c 1 0 c’ 1 0 1 2 a 2 2 b 0 2 c 1 0 1 S Q B T(S) b’ 2 a’ b
SNPs ---> haplotypes: Gusfield (2002) PPH can be reduced to graph realization problem: Recognizing graphic binary matroids. This problems has an almost linear algorithm (that has never been implemented) This also allows efficient enumeration of possible solutions. Question: Are there SNP data that doesn’t allow a perfect tree.
SNPs ---> haplotypes: Stephens (2001) G=(G1,..,Gn) SNP-types. H=(H1,..,Hn) haplotypes F=(F1,..,Fm) population haplotype frequencies. f=(f1,..,fm) sample haplotype frequencies. i.Find F that maximizes the probability of the observed sample. ii. The same for population parameters. iii. Simulation is very easy. H1 H2 H3 H4
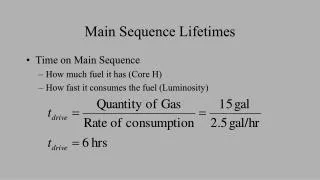
The Exponential Distribution. The Exponential Distribution: R+ Expo(a) Density: f(t) = ae-at, P(X>t)= e-at 0 1 2 3 Properties: X ~ Exp(a) Y ~ Exp(b) independent i. P(X>t2|X>t1) = P(X>t2-t1) (t2 > t1) ii. E(X) = 1/a. iii. P(X < Y) = a/(a + b). iv. min(X,Y) ~ Exp (a + b). v. Sums of k iid Xi is G(k,a) distributed
1 2 3 4 5 The Standard Coalescent Two independent Processes Continuous: Exponential Waiting Times Discrete: Choosing Pairs to Coalesce. Waiting Coalescing {1,2,3,4,5} (1,2)--(3,(4,5)) {1,2}{3,4,5} 1--2 {1}{2}{3,4,5} 3--(4,5) {1,2}{3}{4,5} 4--5 {1}{2}{3}{4}{5}
Additional Evolutionary Factors Geographical Structure. Admixture can create longer LD islands Population Growth. Present LD in the large population can have small population characteristics Recombination/Gene Conversion. GC can create close fall in LD relative to distant LD Selection. Selective sweeps can create strong LDs locally.
Two sequences, infinite sites & k differences --*-------*------*----- ----*----*----*----*--- Exp() Exp(1) The probability that there are k differences between two sequences. Going back in time, 2 kinds of events can occur (mutations ( - or a coalescent (1). This gives a geometric distribution. Ek(MRCA) = TMRCA isG(k+1,1+Q) + distributed. Distribution of waiting time to j’th newest mutation is G(j,1+Q)
n sequences, infinite sites & k differences. Russell Thompson 98 Oldest mutation ----------------------------- 1 ----------------------------- 2 ----------------------------- n s s s s Exp(k) Exp(k(k-1)/2) Only the number of segregating sites are observed. Explicit Expressions or simple recursions exits for distributions analogous to the 2 sequence case.
Classical Polya Urns Feller I. 1 2 3 Let X0 be the initial configuration of the initial Urn. A step: take a random ball the urn and put it back together with an extra of the same colour. Xk be the content after the k’th step. Let Yk be the colour of the k’th picked ball. i. P{Yk =j} = P{Y1 =j}. ii. Sequences Y1 ... Ykresulting in the same Xk - has the same probability.
Labelling, Polya Urns & Age of Alleles (Donnelly,1986 + Hoppe,1984+87) As they come By size By age A ball is picked proportionally to its weight. Ordinary balls have weight 1. If the initial -size ball is picked, it is replaced together with a completely new type. If an ordinary ball is picked, it is replaced together with a copy of itself. An Urn: 1 2 1 1 There is a simple relationship between the distribution of ”the alleles labeled with age ranking” is the same as ”the alleles labeled with size ranking”
n sequences, infinite sites & 1 segregating site (d,n-d) M.Stephens 2000, Griffiths & Tavare,1998 ---------------0------------- 1 ---------------0------------- 2 ---------------0------------- d ---------------+------------- d+1 ---------------+------------- n d+1 … n 1 2 d Distribution of Age of the Mutation: where and Population analogues can be obtained by n2N Lastly
Shape of Tree Hanging below a Mutation Griffiths & Tavare,1998 + 2002 ---------------0------------- 1 ---------------0------------- 2 ---------------0------------- d ---------------+------------- d+1 ---------------+------------- n k lineages d+1 … n 1 2 d Probability that a specified edge when there were k lineages has b descendants. It is possible to describe the shape of the hanging tree.
Mutations & their Branch. Wiuf & Donnelly (1999) Wiuf (2000+2001a,b) f – frequency of mutant, n=1000 Exact expression can be obtained for start and end of mutation branch and position of mutation. Approximations for small (< 10%) mutation tree that also allows the mutation to have a selection coeffecient.
Mutations & their Branch. Wiuf (2001a,b) The Effect of Selection & Growth.
Cystic Fibrosis • (Wiuf 2001) • F508 – possibly maintained by heterosis (1.023)- higher resistance to Salmonella infections. • Data: Frequency of F508-allele - .022. • Inter variability in 1.705 individuals 46 variable positions. • Model of human demography. • Model parameters: mutation rate, heterosis advantage and an exponential growth model of human population expansion. • /\ • * \ • / \ • /\ \ • / \ \ • Estimated age of F508 is estimated to be:
Human History-Two Levels: Physical & Genealogical The physical population size, N(t), and the efficient population size, Ne(t) are separate concepts. i. N(t)can mainly be studied by historical/archeological means, ii. Ne(t)can be studied genealogically, for instance by tracing the ancestries of DNA sequences. Main departures from simplest Population Genetical Models: A. Long epochs of exponential growth at increasing rates B. Bottlenecks. C. Migrations & Geographical subdivisions
Out of Africa ------ Multiregional Model 1st Origin of Humans in Africa 3-5 Myr ago is relatively accepted. A 2nd origin from Africa 150-300 Kyr ago is controversial. 1. Was there a population expansion from Africa replacing the populations in Asia/Europe that left fossil as asserted by the Out of Africa Model. 2. Or did this expansion hybridize with the local population as asserted by the Multiregional Model.
Human Migrations From Cavalli-Sfroza,2001
Cavalli- Sforza: Language Trees Cavalli-Sforza (1997) Genes Peoples and Languages PNAS 94.7719-24 Principle of Comparison. Loss of cognates (“homologous” words) Syntax Comparison. Sound use. Reconstruction dependent on interpretation – stretches back 2-6.000 years dependent on criteria.
Cavalli- Sforza:Principal Components- Agriculture,… Greek Colonisation 3 Kyr Agriculture 6-10 Kyr Retraction of the Basques. Uralic People Horse domestication
986 H. sapiens ts Te Neanderthal Tt Homo Sapiens & the Neanderthal (Nordborg) Two Scenarios: Constant Female Pop.Size 3.400 Growing for 50.000 years to 5*108. Problem: Can the observed be explained by one common H.sapiens - Neanderthal population? Constant Pop.size Recent Growth 30.000 100.000 30.000 100.000 E(A()) 4.86 1.75 782 2.86 P(topology) .085 .56 3.3 10-6 .24 P(topology & Tt > 4Te) .0063 .035 3.7 10-8 .002
Summary The Existing Data: SNPs & Haplotypes. Reconstructing Haplotypes. The Coalescent with Mutations. The Human Population, its history & its Genome. A serious gap between capabilities of theory and the demand of existing data.
History of Coalescent Theory. 1930-40s: Genealogical arguments well known to Wright & Fisher. 1964: Crow & Kimura: Infinite Allele Model 1966: (Hubby & Lewontin) & (Harris) make first surveys of population allele variation by protein electrophoresis. 1968: Motoo Kimura proposes neutral explanation of molecular evolution & population variation. So does King & Jukes 1971: Kimura & Otha proposes infinite sites model. 1975: Watterson makes explicit use of “The Coalescent” 1982: Kingman introduces “The Coalescent”. 1983: Hudson introduces “The Coalescent with Recombination” 1983: Kreitman publishes first major population sequences. 1987: Cann et al. tries to trace human origin and migrations with mitochondrial DNA.
1989-90: Kaplan, Hudson, Takahata and others: Selection regimes with coalescent structure (MHC, Incompatibility alleles). 1988: Hughes & Nei: Genes with positive Darwinian Selection. 1987-95 Griffiths, Ethier & Tavare calculates inf.site data probability. 1991: MacDonald & Kreitman: Data with surplus of replacement interspecific substitutions. 1991: Aquadro & Begun: Positive recombination-nucleotide variation correlation. 1994-: Griffiths-Tavaré + Kuhner-Yamoto-Felsensenstein introduces highly computer intensitive simulation techniquees to estimate parameters in population models. 1996- Krone-Neuhauser introduces selection in Coalescent 1998-Donnelly, Stephens, Fearnhead et al.: Major accelerations in coalescent based data analysis. 1999: Wiuf & Donnelly uses Coalescent Theory to estimate age of disease allele 2000: Wiuf et al. introduces gene conversion into coalescent. 2000-: Several groups combines Coalescent Theory & Gene Mapping. A flood of SNP data & haplotypes are on their way.
Recommended Literature & www-sites Cavalli-Sforza (2001) Genes, People and Language. Penguin. Clark,A. (1990) ”Inference of Haplotypes from PCR-amplified Samples of Diploid Populations Mol.Biol.Evol.7.2.111-122 Daly,JM et al.(2001) High-resolution haplotype structure in the human genome. Nat.Gen. 29.229-32. Donnelly,P. and R.Foley (eds) (2001) Genes, Fossils and Behavious IOS Press. Goldstein, DB & Chikhi (2002) ”Human Migrations and Population Structure” Annu.Rev.Genomics Hum.Genetics (forthcoming) Griffiths, RC ”Ancestral Inference from Gene Trees” in Donnelly,P. and R.Foley (eds) (2001) Genes, Fossils and Behavious IOS Press. Gusfield (2002) Haplotypes as perfect phylogeny. To appear in Recomb2002 Hoppe (1984) ”Polya-like urns and the Ewens’ sampling formula” J.Math.Biol. 20.91-94 Harpending & Rogers (2000) Genetic Perspectives on Human Origins and Differentiation. Annu.Rev. Genom.Hum.Genet. 1.361-85. Inter.SNP Consortium (2001): A map of human genome sequence variation containing 1.42 million SNPs. Nature 409.928-33 Nichols, J. (1997) Modelling Ancient Population Structures and Movement in Linguistics. Annu.Rev.Anthrop.26.359-84. Reich,DE et al.(2001) Linkage disequilibrium in the human genome Nature 411.199-204 Relethford (2001) Genetics and the Search for Modern Human Origins. Wiley Slatkin & Rannala (2000) ”Estimating Allele Age” Annu Rev.Genomics Hum.Genet. 1.225-49 Stephens,M.(1999) ”Times on Trees, and the Age of an Allele” Theor.Pop.Biol. 58.61-75. Stephens,M et al.(2001) ”A New Statistical Method for Haplotype Reconstruction from Population Data” Am.J.Hum.Gen.68.978-989 Templeton, A. (2002) ”Out of Africa again and again” Nature vol416.45-51. Thompson,R. (1998) ”Ages of mutations on a coalescent tree” Math.Bios. 153.41-61. Wiuf & Hein (1997) ”The Number of Ancestors to DNA Sequence” Genetics Wiuf (2000) ”On the Genealogy of a Sample of Neutral Rare Alleles” Theor.Pop.Biol. 58.61-75. Wiuf (2001) ”Rare Alleles and Selection” Theor.Pop.Biol. 59.287-96. Wiuf (2001)Do DF508 heterozygotes have a selective advantage? Genet.Res.Cam. 78.41-47. Wiuf & Donnelly (1999) Conditional Genealogies and the Age of a Mutant. Theor. Pop.Biol. 56.183-201. http://www.sanger.ac.uk/HGP/ http://snp.cshl.org/data/ Mikkel Schierup’s program package www.daimi.au.dk/~compbio/coalescent/ Gil McVean’s course in population genetics: http://www.stats.ox.ac.uk/~mcvean/pgindex.html