Analysis of Exon Inclusion in Neuronal FAK Expression
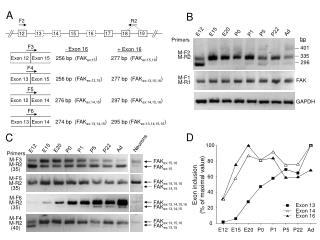
This study investigates the patterns of exon inclusion in the FAK gene across different neuronal stages. Using primers specific for FAK exons, we assess the relative expression levels of Exons 12, 13, 14, 15, and 16 in neurons. The analysis includes quantifying maximal expression values and percentages of exon inclusivity, providing insights into the regulatory mechanisms of FAK in neuronal development and function. Understanding these patterns is critical for elucidating FAK's role in neurobiology.

Analysis of Exon Inclusion in Neuronal FAK Expression
E N D
Presentation Transcript
A B F2 R2 E12 E20 E15 P22 Ad P0 P5 P1 19 12 13 14 15 16 17 18 bp Primers F3 401 - Exon 16 + Exon 16 M-F2 M-R2 335 256 bp (FAKex:15) 277 bp (FAKex:15,16) Exon 12 Exon 15 296 F4 256 bp (FAKex:13,15) 277 bp (FAKex:13,15,16) Exon 13 Exon 15 M-F1 M-R1 FAK F5 297 bp (FAKex:14,15,16) 276 bp (FAKex:14,15) Exon 12 Exon 14 GAPDH F6 274 bp (FAKex:13,14,15) 295 bp (FAKex:13,14,15,16) Exon 13 Exon 14 D C Neurons E20 E15 P22 E12 Ad P1 P5 P0 100 Primers M-F3 M-R2 (35) FAKex:15,16 Exon inclusion (% of maximal value) 80 FAKex:15 M-F5 M-R2 (35) 60 FAKex:14,15,16 FAKex:14,15 40 M-F6 M-R2 (35) FAKex:13,14,15,16 FAKex:13,14,15 Exon 13 20 Exon 14 M-F4 M-R2 (40) Exon 16 FAKex:13,15,16 FAKex:13,15 0 E12 E15 E20 P0 P1 P5 P22 Ad