Debugging SetUID Programs with GDB: A Comprehensive Guide
This guide provides insights into debugging SetUID programs using GDB. It highlights the challenges encountered when attempting to debug SetUID executables both directly and through child processes. Users will learn about the error messages generated and the underlying security principles; specifically, how the kernel restricts access to exception ports for SetUID child processes. The tutorial covers essential GDB commands, the concept of stack frames, and how to effectively analyze values during the debugging process.

Debugging SetUID Programs with GDB: A Comprehensive Guide
E N D
Presentation Transcript
Buffer-overflow Lab Zutao Zhu 09/18/2009
Outline • GDB and SetUID • GDB tutorial • Stack frame • Lab
GDB and SetUID • One unfortunate interaction between gdb and setuid program execution surfaces when you attempt to debug a program that is setuid or forks setuid child processes. Within gdb, execution of setuid processes is not allowed. gdb will have trouble with an app that is setuid or one that attempts to fork a setuid program such as sendmail as a child process using system() or its relatives like popen() and execl() . If you try to debug a program like this, you'll get the error message “sh: privileges disabled because of outstanding IPC access to task” and the program or child process won't execute.
GDB and SetUID • The technical explanation has to do with privileges and exception ports. When gdb is debugging a process, it owns the exception ports of that process. When that process forks a child process, gdb would own the exception ports of that child process as well. But, for security the kernel disallows gdb from owning the exceptions ports of a child process that is setuid. When you attempt this, the kernel generates the privileges disabled error message and the system() call fails
GDB Tutorial • Compilation flag: -g • Basic commands • Examine values
Basic Commands • Run (r) • Break (b) • Continue (c) • Step (s, n) • Backtrace (bt) • List code (l [line #]) • Info breakepoints/frame/proc
Basic Commands • Print (p) • Quit (q) • Shell (shell ls –la ./) • Help (help stack) • Complete (complete i) • Show (show version) • Set (set prompt $; set var x=3)
Basic Commands • Clear (current breakpoint) • Delete (d) • Enable/disable • Condition breakpoint (break main; condition 1 something==val) • Finish (return from a function)
Examine Values • Print (p) • x/i • x/8wx • x/s
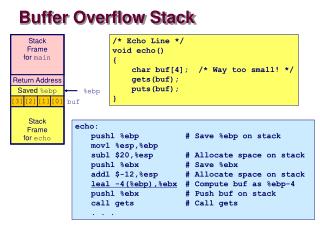
Stack Frame • Each stack frame corresponds to a call to a subroutine which has not yet terminated with a return. For example, if a subroutine named DrawLine is currently running, having just been called by a subroutine DrawSquare, the top part of the call stack might be laid out like this (where the stack is growing towards the top):
Stack Frame • In every stack frame, ebp -> current stack bottom, esp -> stack top, eip -> return address
Lab • Security setting
Reference • http://www.cs.wright.edu/~tkprasad/courses/cs781/alephOne.html • http://www.unknownroad.com/rtfm/gdbtut/gdbtoc.html • http://www.cs.cmu.edu/~gilpin/tutorial/
(gdb) x/24wx 0xbfed9fb0 • 0xbfed9fb0: 0xbfed9fc8 0x002973a5 0xbfedb8cd 0x00000002 • 0xbfed9fc0: 0x00000003 0x00000005 0xbfed9ff8 0x08048420 • 0xbfed9fd0: 0x00000002 0x00000003 0xbfed9fe8 0x080482b9 • 0xbfed9fe0: 0x00ae4fb4 0x00000002 0x00000003 0x0804845e • 0xbfed9ff0: 0xbfeda010 0x00392ff4 0xbfeda038 0x002822f0 • 0xbfeda000: 0x00ae4ca0 0x08048444 0xbfeda038 0x002822f0 • (gdb) p &a[0] • $6 = (int *) 0xbfed9fbc • (gdb) info frame • Stack level 0, frame at 0xbfed9fd0: • eip = 0x80483cf in func1 (temp.c:10); saved eip 0x8048420 • called by frame at 0xbfeda000 • source language c. • Arglist at 0xbfed9fc8, args: x=2, y=3 • Locals at 0xbfed9fc8, Previous frame's sp is 0xbfed9fd0 • Saved registers: • ebp at 0xbfed9fc8, eip at 0xbfed9fcc • (gdb) p &y • $7 = (int *) 0xbfed9fd4 • (gdb) p &x • $8 = (int *) 0xbfed9fd0 • (gdb)