Download
1 / 37
380 likes | 452 Views
Learn about dipole-dipole, London dispersion, and hydrogen bonding forces holding molecules together as liquids and solids. Explore properties like viscosity and surface tension and differentiate between molecular, covalent network, ionic, and metallic solids.

E N D
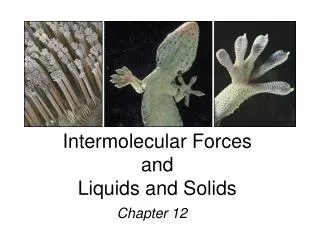
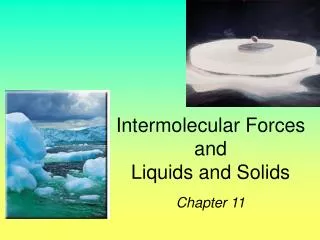
Intermolecular Forces, Liquids, and Solids Seneca Valley SHS AP Chemistry Chapter 10
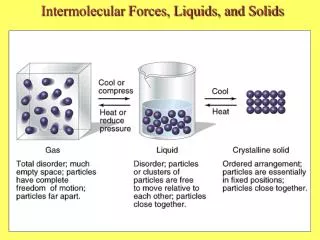
Intermolecular Forces • The attractive forces holding solids and liquids together are called intermolecular forces. The covalent bond holding a molecule together is an intramolecular force • Intermolecular forces are much weaker than intramolecular forces (chemical bonds) (e.g. 16 kJ/mol vs. 431 kJ/mol for HCl). • When a substance melts or boils the intermolecular forces are broken (not the covalent bonds). • When a substance condenses intermolecular forces are formed.
Intermolecular Forces Dipole-Dipole Forces • Molecules orient themselves to maximize the + --- - interactions and minimize the + --- + and - --- -forces. • There is a mix of attractive and repulsive dipole-dipole forces as the molecules tumble. • If two molecules have about the same mass and size, then dipole-dipole forces increase with increasing polarity.
Intermolecular Forces London Dispersion Forces • Weakest of all intermolecular forces. • Exist primarily between noble gases and nonpolar molecules • The nucleus of one molecule (or atom) attracts the electrons of the adjacent molecule (or atom). • For an instant, the electron clouds become distorted. • In that instant a dipole is formed (called an instantaneous dipole). • Relatively weak and short-lived
Intermolecular Forces London Dispersion Forces
Intermolecular Forces London Dispersion Forces • One instantaneous dipole can induce another instantaneous dipole in an adjacent molecule (or atom). • Polarizability is the ease with which an electron cloud can be deformed. • London dispersion forces exist between all molecules. • The greater the surface area available for contact, the greater the dispersion forces. • London dispersion forces between spherical molecules are lower than between sausage-like molecules.
Intermolecular Forces London Dispersion Forces The larger the molecule (the more electrons it contains), the stronger the dispersion force becomes.
Intermolecular Forces Hydrogen Bonding • Special case of dipole-dipole forces. • By experiments: boiling points of compounds with H-F, H-O, and H-N bonds are abnormally high. • Intermolecular forces are abnormally strong. • H-bonding requires H bonded to an electronegative element (most important for compounds of F, O, and N). • Electrons in the H-X (X = electronegative element) lie much closer to X than H. • H has only one electron, so in the H-X bond, the + H presents an almost bare proton to the - X. • Therefore, H-bonds are strong.
Intermolecular Forces Hydrogen Bonding
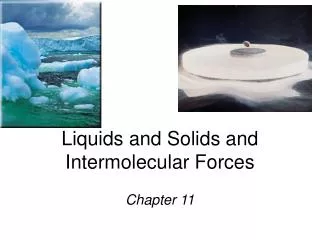
Intermolecular Forces Hydrogen Bonding • Hydrogen bonds are responsible for: • Ice Floating • Solids are usually more closely packed than liquids; • therefore, solids are more dense than liquids. • Ice is ordered with an open structure to optimize H-bonding. • Therefore, ice is less dense than water. • In water the H-O bond length is 1.0 Å. • The O…H hydrogen bond length is 1.8 Å. • Ice has waters arranged in an open, regular hexagon. • Each + H points towards a lone pair on O. • Ice floats, so it forms an insulating layer on top of lakes, rivers, etc. Therefore, aquatic life can survive in winter.
Intermolecular Forces Hydrogen Bonding Hydrogen bonds are responsible for: • Protein Structure • Protein folding is a consequence of H-bonding. • DNA Transport of Genetic Information
Intermolecular Forces Comparing Intermolecular Forces
Some Properties of Liquids Viscosity • Viscosity is the resistance of a liquid to flow. • A liquid flows by sliding molecules over each other. • The stronger the intermolecular forces, the higher the viscosity. • Surface Tension • Bulk molecules (those in the liquid) are equally attracted to their neighbors. Surface tension is the amount of energy required to increase the surface area of a liquid. • Cohesive forces bind molecules to each other. • Adhesive forces bind molecules to a surface.
Some Properties of Liquids Surface Tension
Bonding in Solids • There are four types of solid: • Molecular (formed from molecules) - usually soft with low melting points and poor conductivity. • Covalent network (formed from atoms) - very hard with very high melting points and poor conductivity. • Ions (formed from ions) - hard, brittle, high melting points and poor conductivity. • Metallic (formed from metal atoms) - soft or hard, high melting points, good conductivity, malleable and ductile.
Bonding in Solids Molecular Solids • Intermolecular forces: dipole-dipole, London dispersion and H-bonds. • Weak intermolecular forces give rise to low melting points. • Room temperature gases and liquids usually form molecular solids at low temperatures.
Bonding in Solids Covalent Network Solids • Intermolecular forces: dipole-dipole, London dispersion and H-bonds. • Atoms held together in large networks. • Examples: diamond, graphite, quartz (SiO2), silicon carbide (SiC), and boron nitride (BN).
Bonding in Solids Covalent Network Solids
Bonding in Solids Covalent Network Solids • In diamond: • each C atom is tetrahedral; • there is a three-dimensional array of atoms. • Diamond is hard, and has a high melting point (3550 C). • In graphite: • each C atom is arranged in a planar hexagonal ring; • layers of interconnected rings are placed on top of each other; • the distance between layers is large (3.41 Å);
Bonding in Solids Ionic Solids
Bonding in Solids Ionic Solids • NaCl Structure • Face-centered cubic lattice. • Cation to anion ratio is 1:1. • Examples: LiF, KCl, AgCl and CaO • CsCl Structure • Different from the NaCl structure (Cs+ is larger than Na+). • Cation to anion ratio is 1:1.
Bonding in Solids Metallic Solids
Phase Changes • Surface molecules are only attracted inwards towards the bulk molecules. • Sublimation: solid gas. • Vaporization: liquid gas. • Melting or fusion: solid liq. • Deposition: gas solid. • Condensation: gas liquid. • Freezing: liquid solid. Energy Changes Accompanying Phase Changes • Sublimation: Hsub > 0 (endo) • Vaporization: Hvap > 0 (endo) • Melting or Fusion: Hfus > 0 (endo) • Deposition: Hdep < 0 (exo) • Condensation: Hcon < 0 (exo) • Freezing: Hfre < 0 (exo)
Phase Changes Energy Changes Accompanying Phase Changes • All phase changes are possible under the right conditions (e.g. water sublimes when snow disappears without forming puddles). • The sequence heat solid melt heat liquid boil heat gas is endothermic. • The sequence cool gas condense cool liquid freeze cool solid is exothermic.
Phase Changes Energy Changes Accompanying Phase Changes
Phase Changes Heating Curves • Plot of temperature change versus heat added is a heating curve. • During a phase change, adding heat causes no temperature change. • These points are used to calculate Hfus and Hvap.
Vapor Pressure Explaining Vapor Pressure on the Molecular Level • Some of the molecules on the surface of a liquid have enough energy to escape the attraction of the bulk liquid. • These molecules move into the gas phase. • As the number of molecules in the gas phase increases, some of the gas phase molecules strike the surface and return to the liquid. • After some time the pressure of the gas will be constant at the vapor pressure.
Vapor Pressure Explaining Vapor Pressure on the Molecular Level • Dynamic Equilibrium: the point when as many molecules escape the surface as strike the surface. • Vapor pressure is the pressure exerted when the liquid and vapor are in dynamic equilibrium.
Vapor Pressure Volatility, Vapor Pressure, and Temperature • If equilibrium is never established then the liquid evaporates. • Volatile substances evaporate rapidly. • The higher the temperature, the higher the average kinetic energy, the faster the liquid evaporates.
Vapor Pressure Vapor Pressure and Boiling Point • Liquids boil when the external pressure equals the vapor pressure. • Temperature of boiling point increases as pressure increases. • Two ways to get a liquid to boil: increase temperature or decrease pressure. • Pressure cookers operate at high pressure. At high pressure the boiling point of water is higher than at 1 atm. Therefore, there is a higher temperature at which the food is cooked. • Normal boiling point is the boiling point at 760 mmHg (1 atm).
Phase Diagrams • Phase diagram: plot of pressure vs. Temperature summarizing all equilibria between phases. • Given a temperature and pressure, phase diagrams tell us which phase will exist. • Features of a phase diagram: • Triple point: temperature and pressure at which all three phases are in equilibrium. • Vapor-pressure curve: generally as pressure increases, temperature increases. • Critical point: critical temperature and pressure for the gas. • Normal melting point: melting point at 1 atm.
Phase Diagrams • Any temperature and pressure combination not on a curve represents a single phase.
Phase Diagrams The Phase Diagrams of H2O and CO2 • Triple point at 0.0098C and 4.58 mmHg. • Normal melting (freezing) point is 0C. • Normal boiling point is 100C. • Critical point is 374C and 218 atm • Triple point at -56.4C and 5.11 atm. • Normal sublimation point is -78.5C. • (At 1 atm CO2 sublimes it does not melt.) • Critical point occurs at 31.1C and 73 atm.
Intermolecular Forces, Liquids, and Solids End of Chapter 10