Download
1 / 31
310 likes | 423 Views
Explore the FY 2013 SHERM annual report showcasing metrics-based performance in Losses, Compliance, Finances, and Client Satisfaction. Understand key areas like Personnel and Property Losses while ensuring Compliance with internal and external entities.

E N D
FY13 SHERM Metrics-Based Performance Summary Indicators of Safety, Health, Environment & Risk Management (SHERM) Performance in the Areas of Losses, Compliance, Finances, and Client Satisfaction
Overview • The FY 2013 SHERM annual report provides a metrics-based review of program outcomes in four key balanced scorecard areas: Losses Compliance Personnel With external agencies Property With internal assessments Finances Client Satisfaction Expenditures External clients served Revenues Internal department staff
Key Loss Metrics • Personnel • First reports of injury by employees, residents, students • Injury and Illness rate • Workers’ Compensation Insurance experience modifier • Property • Losses incurredand covered by UTS Comprehensive Property Protection Program • Losses incurred but covered by outside party • Losses retained by UTHealth
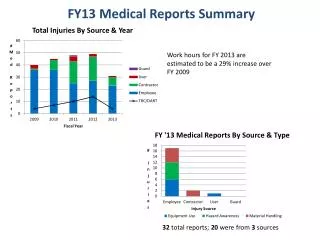
FY13 Number of First Reports of Injury, by Population Type (estimated total population 11,078; employees: 5,665; students: 4,489; resident/fellows: 924) Oversight by SHERM Total (n = 456) Employees (n = 247) Residents (n = 128) Students (n = 81)
Total Number of Employee First Reports of Injury and Subset of Compensable Claims Submitted to UT System, FY03 to FY12 Oversight by SHERM Number of reports without medical claims Number of reports with medical claims
Number of Employee Reported Injuries by Location, FY13 (of 247 total, 233 mapped, 14 occurred in miscellaneous public locations) LBJ 10 MHH 11 29 UTPB 29 JJL 1 MSB 101 HCPC 6 1 MSE HMC SON 2 UCT 11 0 1 SPH SRB CCC 1 BBS 1 20 SOD 0 CDC 0 REC 2 UTPD 2 Housing 3 OCB
Annual UTHealth Incidence Rate of Reported Employee Injuries and Illnesses Compared to Hospital and University Rates and Three Major Companies With Generally Acknowledged “Best in Class Safety” Programs, As Reported by the US Bureau of Labor Statistics
Workers’ Compensation Insurance Premium Experience Modifier for UT System Health Institutions Fiscal Years 03 to 13(premium rating based on a three year rolling average as compared to a baseline of 1.00) Oversight by SHERM UTSWMCD (0.15) UTMB (0.12) UTHSCSA (0.09) UTHSCT (0.09) UTMDACC (0.04) Fiscal Year
FY13 Property Losses • Retained Losses • Losses incurred and covered by third party • Water --12/2012 $1,700 • Auto—--5/2013 $1,100 • Water---11/2012 $22,000 (verbal agreement) • Losses incurred and covered by UTS insurance • Auto—9/2012 $2,300 • Auto—11/2012 $500 • Auto—5/2013 $4,100 • Losses still in process of recovery from 3rd party • Water---7/2012 $175,000 Retained Loss Cost Summary by Peril (Total FY13 retained losses, $113,300) Auto Fire
UTHealth Retained Property Loss Summary by Peril and Value, FY06 to FY13 Hurricane Water
Rapid Estimate of Water Damage Clean Up Cost Based on Area Affected and Type of Water 1 If more than one room or one floor is affected 2 Dirty Water One area affected 3 If more than one room or one floor is affected 2 Clean Water One area affected 3 Square Feet Affected 1 Estimate includes the cost of extracting water, removing affected materials if applicable, drilling holes in sheetrock, equipment rental, service charges, content manipulation, debris removal and moisture readings. Clean water is defined as potable water; dirty water typically involves sewage. 2Mitigating multiple rooms or multiple floors, inclusive of drying is more difficult if the affected area is separated by hard walls or floors, such as is the case of multiple offices or multiple floors. 3Estimated cost to clean up a single area affected that is not separate by hard walls.
FY14 Planned Actions - Losses • Personnel • Closely monitor apparent increase in reported employee injury events, determine root cause and implement preventive measures. • Develop means of estimating rate of employee injuries by building • Improve educational awareness activities through various mechanisms – webpage, postings, outreach presentations • Property • Continue to educate faculty and staff about common perils causing losses (water, power interruption, and theft), simple interventions. • Develop additional predictive methods for prompt recovery after losses occur, specifically estimated length of time to recovery • Given their prevalence, drill down into data on water losses to identify root causes • Incorporate into lease arrangements requirement for leaseholder enrollment in new cost-effective UTS Tenant User Liability Insurance Program (TULIP)
Key Compliance Metrics • With external agencies • Regulatory inspections; other compliance related inspections by outside entities • With internal assessments • Results of EH&S routine safety surveillance activities
Internal Compliance Assessments • 4,508 workplace inspections documented • Progression of routine surveillance program emphasis: labs, building fire systems, now mechanical and non-lab spaces • 5,256 deficiencies identified (80% in non-lab spaces) • 814 deficiencies corrected to date • Remaining 4,442 deficiencies (predominantly minor issues) subject to follow up correction: • Example: mechanical room deficiencies - unlabeled circuit breakers, missing outlet covers, etc. • Working with Facilities to correct, tracking progress and reporting progress to appropriate safety committees • 2,719 individuals provided with required safety training • 73% of PIs submitted required chemical inventories (renewed initiative in FY13)
FY14 Planned Actions - Compliance • External compliance • Update safety training to include updated hazard communication regulations for the new globally harmonized system for the classification and labeling of chemicals (GHS) • Internal compliance • Continue routine surveillance program. Incorporate lessons learned from deficiency data into safety training to prevent recurrence • Continue to work with Facilities, Planning and Engineering to systematically address deficiencies and support current projects to address fire safety violations. • Provide regular updates to appropriate safety committees • Continue emphasis on creation of chemical inventories for labs
Key Financial Metrics • Expenditures • Program cost, cost drivers • Revenues • Sources of revenue, amounts
Campus Square Footage, SHERM Resource Needs and Funding (modeling not inclusive of resources provided for, or necessary for Employee Health Clinical Services Agreement) Total Assignable Square Footage and Research Subset Modeled SHERM Resource Needs and Institutional Allocations Research area (sf) Amount Not Funded Contracts & Training WCI RAP Rebate Non-research area (sf) Institutional Allocation *FY11 EHS assumed HCPC safety responsibilities.
Total Hazardous Waste Cost Obligation and Actual Disposal Expenditures(inclusive of chemical, biological, and radioactive waste streams) Total Hazardous Waste Cost Obligation Actual Disposal Expenditures FY13 savings: $140,005
FY13 Revenues • Service contracts • UT Physicians $235,212 • UT Med Foundation $27,645 • Continuing education courses/outreach • Miscellaneous training honoraria $15,497 • Total $278,354
FY13 Financial Challenges • Need to maintain awareness of cumulative erosive effect of program budget not paralleling campus growth (measured by either square feet or institutional expenditures) • Employee Health Clinical Services Agreement continues to be funded on Risk Management Resource Allocation Program, which is likely to disappear, so permanent line item funding is needed for this program.
FY14 Planned Actions - Financial • Expenditures • Continue aggressive hazardous waste minimization program to contain hazardous waste disposal costs • Renewal of UT System hazardous waste contracts anticipated to have price increase, in particular, for biohazardous/medical waste. • Continue to lobby for dedicated funding for Employee Health Clinical Services Agreement • Revenues • Continue with service contracts and community outreach activities that provide financial support to supplement institutional funding (FY13 revenues equated to about 12% of total budget)
Key Client Satisfaction Metrics • External clients served • Results of HCPC Safety program client satisfaction survey • Internal department staff • Summary of ongoing professional development activities
Client Feedback • Focused assessment of a designated program aspect performed annually: • FY03 – Clients of Radiation Safety Program • FY04 – Overall Client Expectations and Fulfillment of Expectations • FY05 – Clients of Chemical Safety Program Services • FY06 – Clients of SHERM Administrative Support Staff Services • FY07 – Feedback from Employees and Supervisors Reporting Injuries • FY08 – Clients of Environmental Protection Program Services • FY09 – DMO/ASL Awareness Survey of Level of “Informed Risk” • FY10 – Clients of Biological Safety Program Services • FY11 – Feedback on new UTHealth Alert emergency notification system • FY13 – Clients of HCPC Safety Program Services
Survey of HCPC Employees Regarding Safety Program at HCPC Web based survey distributed from July to August 2013 to all HCPC Employees. Survey response rate: 71 out of 436 (16%) • Survey Question Responses • Yes No No Opinion • Do you feel the EHS safety program at HCPC understands your needs 52 (73%) 8 (11%) 11 (16%) • and requirements as an employee / healthcare provider at HCPC? • Do you feel you have adequate access to the EHS safety program (safety 62 (87%) 2 (3%) 7 (10%) • coordinator) via phone, email and/or in person? • Do you feel the EHS safety program at HCPC has adequate knowledge to address 54 (76%) 6 (8%) 11 (16%) • your needs related to safety at HCPC? • Do you feel the EHS safety program at HCPC responds to your requests in an 44 (62%) 5 (7%) 22 (31%) • acceptable time frame? • Do you feel the EHS safety program at HCPC is concerned about staff and patients 55 (80%) 5 (7%) 9 (13%) • well-being? n=69 • Do you feel that the EHS safety program at HCPC establishes collaborative 45 (63%) 6 (9%) 20 (28%) • relationships with other departments at HCPC? • Do you feel the EHS safety program at HCPC communicates safety information 60 (85%) 3 (4%) 8 (11%) • effectively? • Do you feel the EHS safety program at HCPC has reduced interruptions due to 48 (68%) 5 (7%) 18 (25%) • or the length of fire drills at HCPC while maintaining their effectiveness? • Better Same Worse No Previous Experience • If you have worked with other psychiatric hospitals, please rate 17 (25%) 23 (33%) 6 (9%) 23 (33%) • how the current safety program at HCPC compares?
Key Findings • What did we learn? • Majority of respondents feel the HCPC Safety program: • understands needs and requirements • have adequate access to the program • is genuinely concerned about the safety of staff and patients, and • communicates safety information effectively • A significant proportion of respondents did not have an opinion regarding • respond time being acceptable • establishment of collaborative relationships and • reduction of interruptions • Next steps • Develop strategy to improve staff understanding of safety program roles and responsibilities • Explore other means of educational outreach • Possible re-survey in one to two years
Internal Department Staff Satisfaction • Continued support of ongoing academic pursuits – leverage unique linkage with UT SPH for both staff development and research projects that benefit the institution • Weekly continuing education sessions on a variety of topics • Participation in teaching of continuing education course offerings • Membership, participation in professional organizations
FY14 Planned Actions – Client Satisfaction • External Clients • Continue with “customer service” approach to operations • Participate in upcoming student satisfaction survey by contributing assessment question on safety • Collect data for meaningful benchmarking to compare safety program staffing, resourcing, and outcomes • Internal Clients (departmental staff) • Continue with routine professional development seminars • Special focus on emerging issues: safety culture, insider threats, GHS • Continue with involvement in training courses and outreach activities – focus on cross training • Continue mentoring sessions on academic activities • Continue 360o evaluations on supervisors to garner feedback from staff
Metrics Caveats • Important to remember what isn’t effectively captured by these metrics: • Increasing complexity of research protocols • Increased collaborations and associated challenges • Increased complexity of regulatory environment • Impacts of construction – both navigation and reviews • The pain, suffering, apprehension associated with any injury – every dot on the graph is a person • The things that didn’t happen
Summary • Various metrics indicate that SHERM continues to fulfilling its mission of maintaining a safe and healthy working and learning environment in a cost effective manner that doesn’t interfere with operations: • Injury rates continue to be at the lowest rate in the history of the institution • Despite continued growth in the research enterprise, hazardous waste costs aggressively contained • Client satisfaction continues to be measurably high • Impacts of budget reductions experienced at the end of FY11 persists, especially in light of continued campus growth (square footage and research expenditures). Important to protect against erosion of program. • A successful safety program is largely “people powered” – the services most valued by clients cannot be automated! • Resource needs continue to be driven primarily by campus square footage (lab and non-lab)