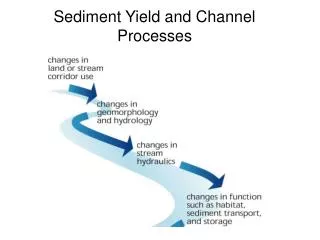
Download
1 / 1
10 likes | 161 Views
Soil Parent Material. West Branch. Ranch Brook. Land Cover Type. Land Cover. Stevenson Brook. Bare rock, quarries. Developed. Clearing, agricultural. Forest. East Branch. Data Source: U.S.G.S. National Land Cover Dataset. Main Stem During Reservoir Drawdown. Bathymetric Map

E N D
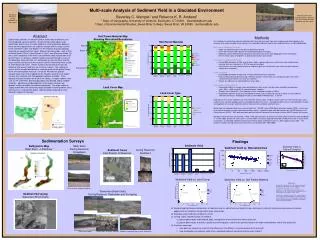
Soil Parent Material West Branch Ranch Brook Land Cover Type Land Cover Stevenson Brook Bare rock, quarries Developed Clearing, agricultural Forest East Branch Data Source: U.S.G.S. National Land Cover Dataset Main Stem During Reservoir Drawdown Bathymetric Map Main Stem – Little River Sediment Cores East Branch of Reservoir (meters) cm GPS survey locations Sediment Yield vs. Soil Parent Material Sediment Yield vs. Slope & Elevation Sediment Yield vs. Watershed Area Thick reservoir sediment deposits Sediment Surveying Stevenson Brook Delta Sediment Yield vs. Land Cover Sediment Yield Stevenson Brook Delta During Reservoir Drawdown and Surveying Delta foreset beds Tent buried in reservoir sediment Sediment reworking after a minor flood event Multi-scale Analysis of Sediment Yield in a Glaciated Environment Beverley C. Wemple1 and Rebecca K. R. Ambers2 1 Dept. of Geography, University of Vermont, Burlington, VT 05401. bwemple@uvm.edu 2 Dept. of Environmental Studies, Sweet Briar College, Sweet Briar, VA 24595. rambers@sbc.edu Waterbury Reservoir during drawdown for dam repair Waterbury Reservoir sediment deposits along the Little River exposed during drawdown for dam repair Abstract Global measurements of sediment yield in watersheds of different sizes have produced a general pattern. All other things being equal, large watersheds tend to have a smaller yield than small watersheds because there are more opportunities for sediment storage within a larger system. In the Little River valley near Stowe, VT, the influence of glacial geology and land use counteracts this trend. Some small watersheds, such as that of Ranch Brook (10 km2), West Branch (12 km2), and Stevenson Brook (15 km2), minor tributaries of the river, have sediment yields ranging from 6-23 tons/km2/year. In contrast, sediment yields measured through surveys of the Waterbury Reservoir (281 km2 watershed) on the Little River and the much smaller east branch of the reservoir (20 km2 watershed) have a yield of 146-188 tons/km2/year. (These numbers do not take reservoir trap efficiency into account and thus are minimum values.) The underlying causes of this bimodal distribution in sediment yield are the glacial history of the area and modern land use. During the Pleistocene, glaciers scoured away much of the regolith on the hillsides, leaving small modern streams with relatively little transportable sediment available. Thick deposits of glacial outwash were left in the valleys, so larger modern rivers such as the Little River, flow through poorly consolidated, highly erodible materials. Agriculture and development in the larger, relatively low-gradient valleys contribute to sediment production. The large sediment supply overwhelms the increased storage available in lower gradient areas and results in a substantially higher sediment yield compared to small, mountain streams in the area. Soil Parent Material Map Showing Watershed Boundaries • Methods • Our methods for estimating sediment yield (tons/km2/year) were derived from core sampling and field mapping in the reservoir area and from direct measurements of suspended sediment yield in two headwater basins as described below. • Main stem of Waterbury Reservoir: • Depth sounding from boat using GPS to determine location • Exact lake level elevation during survey provided by dam managers • Sediment volume determined by comparison of bathymetry to pre-lake topographic map surveyed by • the U.S. Army Corps of Engineers in preparation for dam construction • East branch of Waterbury Reservoir: • During 2002 drawdown of lake level for dam repair, a gouge auger was used to core lake sediment and • measure thickness along with a GPS to map core locations • Core thicknesses were used to create an isopach map of the east branch from which the total sediment • volume was calculated • Stevenson Brook: • During 2002 drawdown of lake level, the entire brook delta was exposed • Field surveying was performed using a GPS for location; stream bank cuts and gouge auger cores were • used to measure thickness of reservoir sediment • Volume of sediment was calculated from survey data • Ranch Brook and West Branch: • Suspended sediment samples were collected over storm events and base flow conditions during water • years 2001 – 2003 using ISCO automated water samplers. • Samples were filtered on 1.5 um fiberglass filters and dried overnight at 105oC. • Suspended sediment rating curve developed for three years of data and used to estimate annual sediment • yield from continuous hydrograph record, as described in Wemple et al., in review. • Bulk density of reservoir sediment was estimated from eleven intact, cylindrical cores taken from the reservoir bed. Core sediment was carefully bagged, dried, and weighed to determine mass. Average bulk density was calculated from the data and applied to all reservoir sediment volume measurements to obtain sediment mass. • Watershed and subwatershed areas were derived from 1:24,000 scale USGS digital elevation models (DEMs), which were also used to compute average slope and elevation metrics. Landcover data were derived from the USGS National Land Cover Dataset (NLCD). Soils data were derived from Natural Resource Conservation Service (NRCS) county soil surveys. • Waterbury Reservoir was constructed in 1938. Field measurements on Stevenson Brook and East Branch were completed in summer 2002 and on the main stem in summer 2004, resulting in elapsed time of 64 and 66 years used in annual yield calculations. Suspended sediment monitoring on Ranch Brook and West Branch has been ongoing since 2001. This analysis includes average yields from three years of monitoring (WY 2001-2003). Land Cover Map Sedimentation Surveys Findings Coring Reservoir Sediment References Dendy, F. E. and Bolton, G. G., 1976. Sediment yield-runoff- drainage area relationships in the United States. Journal of Soil and Water Conservation, v. 31, p. 264-266. Walling, D. E., 1994. Measuring sediment yield from river basins. In R. Lal, ed., Soil Erosion Research Methods, 2nd ed., Soil and Water Conservation Society, p. 38-80. Wemple, B., J. Shanley, J. Denner, D. Ross, and K. Mills, in review. Hydrology and Water Quality in Two Mountain Basins of the Northeastern U.S.: Assessing baseline conditions and effects of ski area development. Submitted to Hydrological Processes (Scientific Briefings). • Regional and international comparisons of sediment yield vs. watershed area typically show a decrease in yield with increasing area because of greater opportunities for sediment storage within larger watersheds. • Waterbury watersheds do not follow this trend. • Instead, higher sediment yields are linked to: • greater percentages of developed, open, and agricultural land (rather than forest land) and • greater percentages of outwash, glacio-lacustrine deposits, and alluvium typically found in the larger valley bottoms (rather than glacial till). • Questions remaining: • How does one account for reservoir trap efficiency in the different surveyed sections of the reservoir? • How comparable are sediment yields from suspended sediment monitoring and reservoir studies?