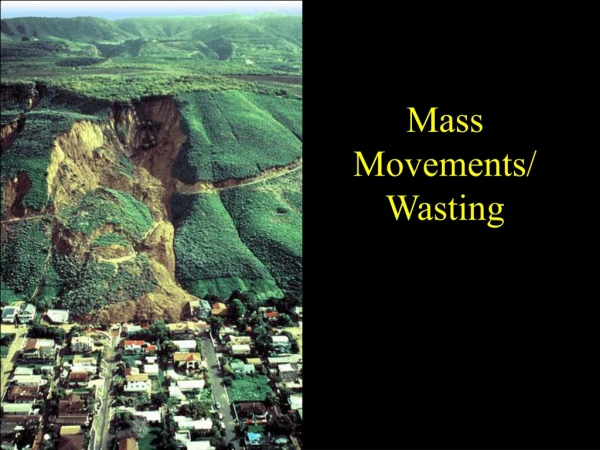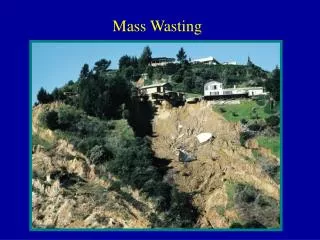
Mass Wasting
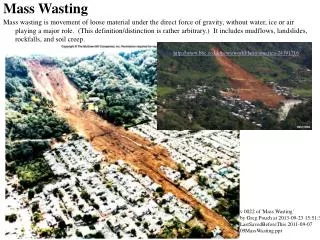
Mass Wasting. Colleen O. Doten August 18, 2004. http://www.for.gov.bc.ca/research/becweb/zone-MH/mh-photos/. Outline. Subsurface Moisture Redistribution in DHSVM Erosion and Sediment Transport Module Implementation Output. Subsurface Moisture Redistribution in DHSVM.

Mass Wasting
E N D
Presentation Transcript
Mass Wasting Colleen O. Doten August 18, 2004 http://www.for.gov.bc.ca/research/becweb/zone-MH/mh-photos/
Outline • Subsurface Moisture Redistribution in DHSVM • Erosion and Sediment Transport Module • Implementation • Output
Subsurface Moisture Redistributionin DHSVM • Soil depth effects dynamics of: • Subsurface moisture storage • Vertical and lateral movement • Predicted saturation thickness (saturated depth/total soil depth) • Soil saturation is determined using the subsurface routing scheme of Wigmosta and Lettenmaier (1999)
Outline • Subsurface Moisture Redistribution in DHSVM • Erosion and Sediment Transport Module • Implementation • Output
Q Qsed Erosion and Sediment Transport Module MASS WASTING Soil Moisture Content Sediment Channel Flow Sediment DHSVM Precipitation Leaf Drip Infiltration and Saturation Excess Runoff CHANNEL ROUTING Erosion Deposition HILLSLOPE EROSION ROAD EROSION
Failure Prediction • Mass wasting algorithm performed at a finer resolution • TOPMODEL topographic wetness index used to redistribute soil saturation (Beven and Kirkby, 1979; Burton and Bathurst, 1998) • Run for critical times
Failure Prediction • Slope stability is a function of • Soil moisture • Slope • Soil properties • Vegetation properties • Failure is determined using the infinite slope model with a factor of safety (FS):
Failure Prediction • Soil and vegetation characteristics described by probability distributions • Soil cohesion • Angle of internal friction • Root cohesion • Vegetation surcharge
Mass Redistribution • Failures occur one pixel at a time. • Failure travels down slope of steepest descent. • Failed area can increase due to the initial failure. • Failure runs out an empirically determined distance. The failed volume is evenly distributed along the runout distance. • Failures entering the channel system continue as debris flows depending on the junction angle.
Probability of Failure Change in Soil Depth Northing, m Northing, m Northing, m Easting, m Easting, m Easting, m
Outline • Subsurface Moisture Redistribution in DHSVM • Erosion and Sediment Transport Module • Implementation • Output
Test Catchment – Rainy Creek • Drainage area of 44 km2 • Snowmelt dominated basin • Mean annual inferred precipitation of 150 to 230 cm (PRISM) • Elevation range 630 to 2150 m
Rainy Creek Spatial Data Loamy sand Sandy Loam Fine Sandy Loam Loam Organic Bedrock Water Fragmented Rock Depth, m Soil Types Soil Depth COLD_int1,3 COOL_int1,2,3 DRY_int1,2,3 DRY_ofms2,3 Forest_si1,2,3 MOIST_int1,2,3 Grassland Shrubland Water Rock Barren degrees Mean slope: 26 Slope Vegetation Types Provided by USDA Forest Service Pacific Northwest Research Station and Wenatchee Forestry Sciences Laboratory
Sediment Module Implementation • Fine resolution DEM (10-m) (USDA Forest Service) • Fine resolution mask (10-m) (UW) • Spatially variable parameters • Soil Parameters • Cohesion distribution: 4.5 – 22 kPa (Hammond et al. ,1992, and others) • Angle of internal friction distribution: 29 – 42 degrees (Hammond et al. ,1992) • Vegetation Parameters • Cohesion distribution: 2 - 23 kPa (Hammond et al. (1992), Burroughs and Thomas (1977), Montgomery et al. (1998), Dietrich et al. (1995), Wu et al. (1979), Wu (1984), Ziemer (1981)) • Vegetation Surcharge distribution: 0 – 195.4 kg/m2 (Hammond et al. ,1992) • Run for a six year period: 10/1/1991 to 9/30/1997 • Mass wasting algorithm was run for six events: • 05/08/1992 • 05/18/1993 • 05/30/1995 • 06/08/1996 • 05/17/1997 • 06/15/1997
Modeled Saturated Fraction Saturated depth/ Soil depth
Outline • Subsurface Moisture Redistribution in DHSVM • Erosion and Sediment Transport Module • Implementation • Output
Default Output • AggregatedSediment.Values • Saturated thickness (basin average, 0-1) • Delta soil depth (basin average in m) • Failure probability (basin average, 0-1) • Total Mass wasting (m3) • Total Mass Deposition (m3) • Total Sediment to Channel (m3) • MassSediment.Balance • Total Mass wasting (m3) • Total Mass Deposition (m3) • Total Sediment to Channel (m3) • Total Mass Wasting Final Sediment Mass Balance MassWasted (m3): 8.88e+04 SedimentToChannel (m3): 3.25e+04 MassDepostion (m3): 5.63e+04 Mass Error (m3): -3.679688e+00
Default Output • failure_summary.txt • Average number of failures • Average number of pixels per failure • Total number of failed pixels with a probability > prescribed threshold • saturation_extent.txt • Total number of pixels with saturated fraction > MTHRESH
Optional Output Model Maps (binary file) and Graphic Images (real-time): • Fine Map DEM, m • Fine Map Saturated Thickness, 0-1 • Fine Map Delta Depth, m • Fine Map Failure Probability, 0-1 • Sediment to Channel, m3
Modeled Maximum Probability of Failure • 82% soil depth > 1.5 m (12% of areas with soil depth > 1.5 m) • 26% had soil type of loam or organic (40% of areas with these soil types) • 40% had vegetation type of shrubland or barren (39% of areas with this vegetation type) • Mean slope 30.7º Northing, m Easting, m
Modeled Change in Soil Depth Annual sliding rate (kg/ha) Estimated rate: 3,317 Simulated rate: 5,700 Annual sliding rate (kg/ha) Vegetation Category 1: 4,300 Vegetation Category 2: 1,390 Vegetation Category 3: < 1 Vegetation Category 4: 0 Adjusted simulated rate: 4,450 (0.26 mm/yr) Northing, m Aerial Photograph Survey • 5 stereo pairs spanning 22 years (1970-1992) • Mapped 62 slides using a confidence level scheme Rock, Water DRY_ofms2,3 COOL_int1,3, COLD_int1,2,3, DRY_int1,2,3, MOIST_int1,2,3 Forest_si1,2,3, Grassland, Shrubland, Barren Easting, m Vegetation Category
Modeled Channel Routing Results Simulated Rates, kg/ha/yr Hillslope erosion: 634 Road surface erosion: 17 – 41 (164 – 394 kg/km road) (3,247–7,842 kg/ha of road) Sediment Yield: 1,000 – 1,020 Published Rates, kg/ha/yr Hillslope erosion: 8 – 100 (north central WA) Road surface erosion: • 3,800 to 500,000 kg/km of road (Olympic Peninsula, WA) • 12,000 to 55,000 kg/ha of road (central ID) Sediment Yield: 813 – 13,500 (coastal OR and CA, western WA)
Sensitivity Analysis • Many have performed sensitivity analysis on the infinite slope model: • Gray and Megahan, 1981 • Hammond et al. 1992 • Wu and Sidle, 1995 • Borga et al., 2002 • For parameters tested, we had similar results: • most sensitive to soil cohesion, root cohesion and soil depth • less sensitive to angle of internal friction • insensitive to saturated density and vegetation surcharge
Sensitivity Analysis – Soil Depth Existing Change in Soil Depth:-0.72 to 1.4 m Annual Rate: 6,745 kg/ha Exisiting - 0.5m Change in Soil Depth:-0.28 to 0.81m Annual Rate: 1,995 kg/ha Existing + 0.5m Change in Soil Depth:-1.4 to 3.5 m Annual Rate: 21,700 kg/ha
Sensitivity Analysis – Soil Depth Existing Maximum Failure Probability: 0 to 0.28 Exisiting - 0.5m Maximum Failure Probability: 0 to 0.07 Existing + 0.5m Maximum Failure Probability: 0 to 0.54
Sensitivity Analysis – Event Criteria Greatest Saturation Extent Change in Soil Depth:-0.72 to 1.4 m Annual Rate: 6,745 kg/ha Six Largest Storms Change in Soil Depth:-0.39 to 0.4 m Annual Rate: 610 kg/ha Days (15) with precipitation > 4 cm Change in Soil Depth:-0.42 to 0.61 m Annual Rate: 875 kg/ha
Sensitivity Analysis – Event Criteria Greatest Saturation Extent Maximum Failure Probability: 0 to 0.28 Six Largest Storms Maximum Failure Probability: 0 to 0.14 Days (15) with precipitation > 4 cm Maximum Failure Probability: 0 to 0.14
References Amaranthus, M.P., R.M. Rice, N.R. Barr, and R.R. Ziemer, 1985: Logging and Forest Roads Related to Increased Debris Slides in Southwestern Oregon, Journal of Forestry, 83, 229-233. Benda, L., and T. Dunne, 1997a: Stochastic forcing of sediment supply to channel networks from landsliding and debris flow, Water Resour. Res., 33, 2849-2863. Bergen, K.J., C.O. Doten, and D.P. Lettenmaier, 2003. Landslide rates in the Eastern Cascade Mountain Range, poster presented at the American Geophysical Union Fall Meeting, San Francisco. Beven, K.J. and M.J. Kirkby, 1979: A physically based, variable contributing area model of basin hydrology, Hydrological Sciences Bulletin, 24, 43-69. Beven, K.J. and M.J. Kirkby, 1979: A physically based, variable contributing area model of basin hydrology, Hydrological Sciences Bulletin, 24, 43-69. Burroughs, E.R., Jr. and B.R. Thomas, 1977: Declining root strength in Douglas-Fir after felling as a factor in slope stability. Res. Pap. INT-190, Ogden, UT. US Depart. of Agriculture, Forest Service, Intermountain Forest and Range Experiment Station, 27 p. Burton, A. and J.C. Bathurst, 1998: Physically based modeling of shallow landslide sediment yield at a catchment scale, Environmental Geology, 35, 89-99. Burton, A., T.J. Arkell, and J.C. Bathurst, 1998: Field variability of landslide model parameters, Environmental Geology, 35, 110-115. Dietrich, R.V., J.J.T. Dutro, and R.M. Foose, 1982: AGI Data Sheets for geology in the field, laboratory, and office, 2nd ed., American Geological Institute, Falls Church, VA. Dietrich, W.E. and T. Dunne, 1978: Sediment budget for a small catchment in mountainous terrain: Z. Geomorph., Suppl. Bd. 29, 191-206. Dietrich, W.E., R. Reiss, M. Hsu, and D.R. Montgomery, 1995: A process-based model for colluvial soil depth and shallow landsliding using Digital Elevation Data, Hydrol. Process., 9, 383-400. Gray, W.H. and W.F. Megahan, 1981, Forest vegetation removal and slope stability in the Idaho batholith, Res. Pap. INT-271, USDA For. Serv., Ogden, Utah. Hammond, C., D. Hall, S. Miller and P. Swetik, 1992: Level I Stability Analysis (LISA) Documentation for version 2.0, USDA Intermountain Research Station, General Technical Report INT-285. Koler, T.E., 1998: Evaluating slope stability in forest uplands with deterministic and probabilistic models, Environmental and Engineering GeoScience, 4, 185-194.
References Montgomery, D.R. and W.E. Dietrich, 1994: A physically based model for topographic control on shallow landsliding, Water Resour. Res., 30, 1153-1171. Montgomery, D.R., K. Sullivan, and H.M. Greenberg, 1998: Regional test of a model for shallow landsliding, Hydrol. Process., 12, 943-955. Reiners, P.W., T.A. Ehlers, S.G. Mitchell, and D.R. Montgomery, 2003, Coupled spatial variation in precipitation and long-term erosion rates across the Washington Cascades, Nature, 426, 645-647. Reneau, S.L. and W.E. Dietrich, 1987: Size and location of colluvial landslides in a steep forested landscape, In: Beschta R.L., T. Blinn, G.E. Grant, G.G. Ice, and F.J. Swanson (eds), Erosion and sedimentation in the Pacific Rim, IAHS Publ. No. 165, Institute of Hydrology, Wallingford, Oxfordshire, UK. Selby, M.J., 1982, Hillslope materials and processes, Oxford [Oxfordshire]; New York: Oxford University Press. Sidle, R.C., A.J. Pearce, and C.L. O’Loughlin, 1985, Hillslope stability and land use. Water Resources Monograph Series 11, American Geophysical Union, Washington D.C. Ward, T.J., R. Li, and D.B. Simons, 1981: Use of a mathematical model for estimating potential landslide sites in steep forested drainage basins, In: Erosion and sediment transport in Pacific Rim steeplands, T.R.H. Davies ad A.J. Pearce (eds), IAHS Publ. No. 132, Institute of Hydrology, Wallingford, Oxfordshire, UK Wigmosta M.S. and D.P. Lettenmaier, 1999: A comparison of simplified methods for routing topographically-driven subsurface flow, Water Resour. Res., 35, 255-264. Wolock, D.M. and G.J. McCabe Jr., 1995: Comparison of single and multiple flow direction algorithms, Water Resour. Res., 31, 1315-1324. Wu, T.H., W.P. McKinnel and D.N. Swanston, 1979: Strength of tree roots and landslides on Prince of Wales Island, Alaska, Can. Geotech. J., 16, 19-33. Wu, T.H., 1984: Effect of vegetation on slope stability. Transportation Res. Rec. 965. Washington, DC: Transportation Research Board. 37-46. Wu, W., and R.C. Sidle, 1995: A distributed slope stability model for steep forested basins, Water Resour. Res., 31, 1097-2110.Borga, M., G. Dalla Fontana, C. Gregoretti, and L. Marchi, 2002: Assessment of shallow landsliding by using physically based model of hillslope stability, Hydrol. Process., 16, 2833-2851. Ziemer, R.R., 1981: Roots and stability of forested slopes, In: Davies, T.R.H. and A.J. Pearce (eds), Erosion and Sediment Transport in Pacific Rim Steeplands, IAHS Publ. No. 132, Institute of Hydrology, Wallingford, Oxfordshire, UK.