Download
1 / 15
150 likes | 371 Views
The Dutch Virtual Census of 2001 A New Approach by Combining Different Sources. Eric Schulte Nordholt ECE Census meetings Geneva, 22-26 November 2004. Contents. Introduction Census Data sources Combining data sources: micro-linkage Combining sources: micro-integration

E N D
The Dutch Virtual Census of 2001A New Approach by CombiningDifferent Sources Eric Schulte Nordholt ECE Census meetings Geneva, 22-26 November 2004
Contents • Introduction Census • Data sources • Combining data sources: micro-linkage • Combining sources: micro-integration • Social Statistical Database (SSD) • Census tables • History of the Dutch Census • Comparison with Censuses in other countries • Conclusions
Introduction Census • Why a Census ? • Statistical information for research and policy purposes • What kind of information ? • Size of (sub)population(s) • Demographic and socio-economic characteristics, at national and regional level • Gentlemen’s agreement • Eurostat: co-ordinator of EU, accesion and EFTA • countries in the 2001 Census Round • Census Table Programme, every 10 years
Data sources • Registers: • Population Register (PR),16 million recordsdemographic variables: sex, age, household status etc. • Jobs file, employees, 6.5 million records,and self-employed persons, 790 thousand recordsdates of job, branch of economic activity • Fiscal administration (FIBASE)jobs,7.2 million records, and pensions and life insurance benefits, 2.7 million records • Social Security administrations, 2 million records,auxiliary information integration process • Surveys: • Survey on Employment and Earnings (SEE), 3 million records,working hours, place of work • Labour Force Survey (LFS), 2 years: 230.000 recordseducation, occupation, (economic) activity
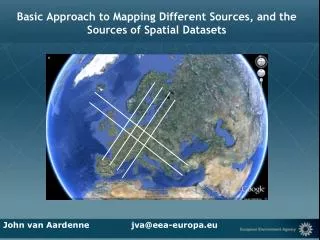
Combining sources: micro-linkage • Linkage key:RegistersSocial security and Fiscal number (SoFi), uniqueSurveys Sex, date of birth, address (postal code and house number) • Linkage key replaced by RIN-person • Linkage strategyOptimizing number of matchesMinimizing number of mismatches and missed matches
Combining sources: micro-integration • Collecting data from several sources more comprehensive and coherent information on aspects of person’s life • Compare sources - coverage - conflicting information (reliability of sources) • Integration rules • - checks - adjustments - imputations • Optimal use of information quality improves • Example: job period vs. benefit period
Social Statistical Database (SSD) • Social Statistical Database (SSD): Set of integrated micro-data files with coherent and detailed demographic and socio-economic data on persons, households, jobs and benefits • No remaining internal conflicting information • SSD-set: • Population Register (back bone) • Integrated jobs file • Integrated file of (social and other) benefits • Surveys, e.g. LFSCombining element:RIN-person
Census tables (1) • Preliminary work before tabulating • Census Programme definitions:not always clear and unambiguous, e.g. economic activity • Priority rules • (characteristics of) main job (highest wage) • employee or employer • job or (partially) unemployed • job or attending education • job or retired • engaged in family duties or retired • age restrictions • Tabulating register variables:simply straightforward counting from SSD-register data
Census tables (2) • Tabulating survey (and register) variables • Mass imputation? • Pro’s:reproducible results • Con’s: danger of oddities in estimates (e.g. high educated baby) • Traditional Weighting? • Pro’s:simple, reproducible results (if same micro-data and weights) • Con’s:no overall numerical consistency between survey and register estimates • Demand for overall numerical consistency • 1 figure for 1 phenomenon • all tables based on different sources (e.g. surveys) should be mutually consistent
educLo...Hi employ1...m ethnic1...k Register Survey1 Register Survey1 Survey 2 Survey 2 • ethnic • not-NL • NL • Total • 30 • 70 Census tables (3), example • Ethnicity: register • Education: survey 1 and survey 2 • Employment status: survey 2 • Estimate: T1: educ x ethnic and T2: educ x employ Survey 2
Census tables (4) • Repeated Weighting (RW) : tool to achieve numerical consistency(VRD-software) • Basic principles of RW: • estimate table on most reliable source (mostly source with most records, e.g. register) • estimate tables by calibrating on common margins of the current table and tables already estimated (auxiliary information) • repeatedly use of regression estimator: • - initial weights (e.g. survey weights) calibrated as minimal as possible • - lower variances • - no excessive increase of (non-response) bias (as long as cell size>>0) • each table own set of weights
educLo...Hi employ1...m ethnic1...k Register Survey1 Register Survey1 2 Survey 2 Survey 2 3 1 Census tables (5), example continued Calibrate on ethnic, then on educ x ethnic Survey 2
History of the Dutch Census • TRADITIONAL CENSUS • Ministry of Home Affairs: • 1829, 1839, 1849, 1859, 1869, 1879 and 1889 • Statistics Netherlands: • 1899, 1909, 1920, 1930, 1947, 1960 and 1971 • Unwillingness (non-response) and reduction expenses no more Traditional Censuses • ALTERNATIVE: VIRTUAL CENSUS • 1981 and 1991: Population Register and surveys • development 90’s: more registers → • 2001: integrated set of registers and surveys, SSD
Comparison with Censuses inother countries • Traditional Census (complete or partial enumeration): Most countries (Estonia, Slovenia, Greece and the UK) • Mixture of traditional Census and Registers: • Some countries (Norway and Switzerland) • Entirely or largely register-based Census: • A few Nordic countries (Sweden and Finland) • Virtual Census: • The Netherlands • Tables: http://www.cbs.nl/en/publications/articles/general/census-2001/census-2001.htm • Book: http://www.cbs.nl/en/publications/recent/census-2001/b-57-2001.htm
Conclusions • The Dutch Virtual Census 2001 was successfulwith its innovative approach: • new source: SSD, integration of registers and surveys (micro-integration remains important) • new methodology for consistent estimation was implemented • Pro’s: relatively cheap (cost per inhabitant) and quick • Con’s:publication of small subpopulations sometimes difficult or even impossible because of limited information • Solutions for Con’s: • small area estimation (synthetic estimators)