CHAPTER 13 RENAL TRANSPLANTATION
760 likes | 1.02k Views
CHAPTER 13 RENAL TRANSPLANTATION. Editor: Dr. Goh Bak Leong Expert Panel: Dato’ Dr. Zaki Morad b Mohd Zaher (Chair) Dr. Goh Bak Leong (Co-Chair) Dr. Fan Kin Sing Dr. Lily Mushahar Mr. Rohan Malek Dr. S. Prasad Menon Dr. Tan Si Yen.

CHAPTER 13 RENAL TRANSPLANTATION
E N D
Presentation Transcript
CHAPTER 13RENAL TRANSPLANTATION Editor: Dr. Goh Bak Leong Expert Panel: Dato’ Dr. Zaki Morad b Mohd Zaher (Chair) Dr. Goh Bak Leong (Co-Chair) Dr. Fan Kin Sing Dr. Lily Mushahar Mr. Rohan Malek Dr. S. Prasad Menon Dr. Tan Si Yen
Table 13.1.1: Stock and Flow of Renal Transplantation, 2000-2009 17th MDTR report 2009, Malaysia
New patients Functioning graft at 31st Dec 1,800 1,600 1,400 1,200 1,000 No. of patients 800 600 400 200 0 2000 2001 2002 2003 2004 2005 2006 2007 2008 2009 Year Figure 13.1.1: Stock and Flow of Renal Transplantation, 2000-2009 17th MDTR report 2009, Malaysia
Table 13.1.2: New transplant rate per million population (pmp), 2000-2009 17th MDTR report 2009, Malaysia
10 9 8 7 6 New Transplant rate, pmp 5 4 3 2 1 0 2000 2001 2002 2003 2004 2005 2006 2007 2008 2009 Year Figure 13.1.2: New transplant rate, 2000-2009 17th MDTR report 2009, Malaysia
Table 13.1.3: Transplant prevalence rate per million population (pmp), 2000-2009 17th MDTR report 2009, Malaysia
65 60 55 50 45 40 Transplant Prevalence rate, pmp 35 30 25 20 15 10 5 0 2000 2001 2002 2003 2004 2005 2006 2007 2008 2009 Year Figure 13.1.3: Transplant prevalence rate, 2000-2009 17th MDTR report 2009, Malaysia
Table 13.1.4: Place of transplantation, 2000-2009 17th MDTR report 2009, Malaysia
Table 13.2.1: Renal Transplant Recipients’ Characteristics, 2000-2009 17th MDTR report 2009, Malaysia
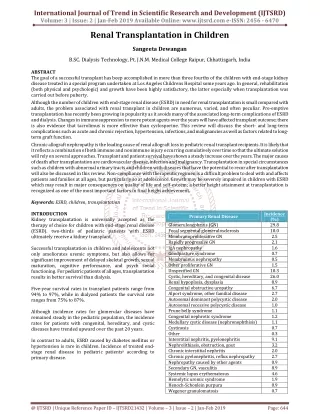
Table 13.2.2: Primary causes of end stage renal failure, 2000-2009 17th MDTR report 2009, Malaysia
Table 13.3.1: Type of Renal Transplantation, 2000-2009 17th MDTR report 2009, Malaysia
Table 13.3.2: Biochemical data, 2006-2009 17th MDTR report 2009, Malaysia
Table 13.3.3: Medication data, 2006-2009 17th MDTR report 2009, Malaysia
Table 13.4.1: Post-transplant complications, 2006-2009 17th MDTR report 2009, Malaysia
Table 13.4.2: Transplant Patients Death Rate and Graft Loss, 2000-2009 17th MDTR report 2009, Malaysia
5 4.5 4 3.5 3 Death rate % 2.5 2 1.5 1 .5 0 2000 2001 2002 2003 2004 2005 2006 2007 2008 2009 Year Figure 13.4.2(a): Transplant Recipient Death Rate, 2000-2009 17th MDTR report 2009, Malaysia
4 3.5 3 2.5 Death rate % 2 1.5 1 .5 0 2000 2001 2002 2003 2004 2005 2006 2007 2008 2009 Year Figure 13.4.2(b): Transplant Recipient Graft Loss Rate, 2000 – 2009 17th MDTR report 2009, Malaysia
Table 13.4.3: Causes of Death in Transplant Recipients, 2000-2009 17th MDTR report 2009, Malaysia
Table 13.4.4: Causes of Graft Failure, 2000-2009 17th MDTR report 2009, Malaysia
Table 13.5.1(a) : Patient survival, 2000-2009 17th MDTR report 2009, Malaysia
Transplant patient survival, 2000-2009 1.00 0.75 0.50 Cumulative survival 0.25 0.00 0 1 2 3 4 5 6 7 8 9 10 Duration in years Figure 13.5.1(a): Patient survival, 2000-2009 17th MDTR report 2009, Malaysia
Table 13.5.1(b): Risk factors for transplant patient survival 2000 - 2009 17th MDTR report 2009, Malaysia
Adjusted Transplant patient survival by Year of Transplant, 2000-2009 1.00 Year 2005-2009 0.75 Cumulative survival 0.50 Year 2000-2004 0.25 0.00 0 1 2 3 4 5 6 7 8 9 10 Duration in years Figure 13.5.1(b): Adjusted Transplant Patient Survival related to Year of Transplant, 2000-2009 (adjusted for age, gender, primary diagnosis, type of transplant, HBsAg and Anti-HCV status) 17th MDTR report 2009, Malaysia
Table 13.5.2 (a): Graft survival, 2000-2009 17th MDTR report 2009, Malaysia
Transplant graft survival, 2000-2009 1.00 0.75 0.50 Cumulative survival 0.25 0.00 0 1 2 3 4 5 6 7 8 9 10 Duration in years Figure 13.5.2 (a): Graft survival, 2000-2009 17th MDTR report 2009, Malaysia
Table 13.5.2(b): Risk factors for transplant graft survival 2000 - 2009 17th MDTR report 2009, Malaysia
Adjusted Transplant Graft survival by Year of Transplant, 2000-2009 1.00 0.75 0.50 Cumulative survival Year 2005-2009 0.25 Year 2000-2004 0.00 0 1 2 3 4 5 6 7 8 9 10 Duration in years Figure 13.5.2(b): Adjusted Transplant Graft Survival related to Year of Transplant, 2000-2009 (adjusted for age, gender, primary diagnosis, type of transplant, HBsAg and Anti-HCV status) 17th MDTR report 2009, Malaysia
Table 13.5.3: Unadjusted Patient survival by type of transplant, 2000-2009 17th MDTR report 2009, Malaysia
Transplant patient survival by Type of Transplant, 2000-2009 1.00 Live donor Commercial cadaver Commercial live donor 0.75 Cadaver 0.50 Cumulative survival 0.25 0.00 0 1 2 3 4 5 6 7 8 9 10 Duration in years Figure 13.5.3: Patient survival by type of transplant, 2000-2009 17th MDTR report 2009, Malaysia
Table 13.5.4: Graft survival by type of transplant, 2000-2009 17th MDTR report 2009, Malaysia
Transplant graft survival by Type of Transplant, 2000-2009 1.00 Live donor 0.75 Commercial cadaver Commercial live donor 0.50 Cumulative survival Cadaver 0.25 0.00 0 1 2 3 4 5 6 7 8 9 10 Duration in years Figure 13.5.4: Graft survival by type of transplants, 2000-2009 17th MDTR report 2009, Malaysia
Table 13.5.5: Patient survival by year of transplant (Living related transplant, 2000-2009) 17th MDTR report 2009, Malaysia
Transplant patient survival by Year of Transplant, 2000-2009 1.00 Year 2005-2009 Year 2000-2004 0.75 Cumulative survival 0.50 0.25 0.00 0 1 2 3 4 5 6 7 8 9 10 Duration in years Figure 13.5.5: Patient survival by year of transplant (Living related transplant, 2000-2009) 17th MDTR report 2009, Malaysia
Table13.5.6: Graft survival by year of transplant (Living related transplant, 2000-2009) *No.=Number at risk SE=standard error 17th MDTR report 2009, Malaysia
Transplant graft survival by Year of Transplant, 2000-2009 1.00 Year 2005-2009 0.75 Year 2000-2004 Cumulative survival 0.50 0.25 0.00 0 1 2 3 4 5 6 7 8 9 10 Duration in years Figure 13.5.6: Graft survival by year of transplant (Living related transplant, 2000-2009) 17th MDTR report 2009, Malaysia
Table 13.5.7: Patient survival by year of transplant (Commercial cadaver transplant, 2000-2009) 17th MDTR report 2009, Malaysia
Transplant patient survival by Year of Transplant, 2000-2009 1.00 Year 2005-2009 Year 2000-2004 0.75 Cumulative survival 0.50 0.25 0.00 0 1 2 3 4 5 6 7 8 9 10 Duration in years Figure 13.5.7: Patient survival by year of transplant (Commercial cadaver transplant, 2000-2009) 17th MDTR report 2009, Malaysia
Table 13.5.8: Graft survival by year of transplant (Commercial cadaver transplant, 2000-2009) *No.=Number at risk SE=standard error 17th MDTR report 2009, Malaysia
Transplant graft survival by Year of Transplant, 2000-2009 1.00 Year 2005-2009 0.75 Year 2000-2004 Cumulative survival 0.50 0.25 0.00 0 1 2 3 4 5 6 7 8 9 10 Duration in years Figure 13.5.8: Graft survival by year of transplant (Commercial cadaver transplant, 2000-2009) 17th MDTR report 2009, Malaysia
Table 13.6.1: Risk factors for IHD in renal transplant recipients at year 2006, 2007, 2008 and 2009 **Hypertension: BP systolic > 140 and BP diastolic > 90 OR have either Beta blocker / Calcium channel blocker / ACE inhibitor / AIIRB / Other anti-hypertensive drugs GFR (mL/min/1.73m2) = 1.2*(140-age(year))*weight(kg) / creatinine (µmol/L) if male GFR (mL/min/1.73m2) = 0.85*(1.2*(140-age(year))*weight(kg) / creatinine (µmol/L) if female CKD stage III-GFR, 30-60 CKD stage IV-GFR, 15-30 CKD stage V-GFR, <15 17th MDTR report 2009, Malaysia
2006 2007 2008 2009 Figure 13.6.1(b): Venn Diagram for Pre and Post Transplant Complications (in %) at year 17th MDTR report 2009, Malaysia
Figure 13.6.1(a): Venn Diagram for Pre and Post Transplant Complications (in %) at year 2006 17th MDTR report 2009, Malaysia
Figure 13.6.1(b): Venn Diagram for Pre and Post Transplant Complications (in %) at year 2007 17th MDTR report 2009, Malaysia
Figure 13.6.1(c): Venn Diagram for Pre and Post Transplant Complications (in %) at year 2008 17th MDTR report 2009, Malaysia
Figure 13.6.1(d): Venn Diagram for Pre and Post Transplant Complications (in %) at year 2009 17th MDTR report 2009, Malaysia
Table 13.6.2(a): Systolic BP, 2006-2009 17th MDTR report 2009, Malaysia
Systolic BP <120 Systolic BP 120-129 Systolic BP 130-139 Systolic BP 140-159 Systolic BP 160-179 Systolic BP >=180 100 80 60 Percent 40 20 0 2006 2007 2008 Year Figure 13.6.2(a): Systolic BP, 2006-2009 17th MDTR report 2009, Malaysia
Table 13.6.2(b): Diastolic BP, 2006-2009 17th MDTR report 2009, Malaysia
Diastolic BP <80 Diastolic BP <85 Diastolic BP 85-89 Diastolic BP 90-99 Diastolic BP 100-109 Diastolic BP >=110 100 80 60 Percent 40 20 0 2006 2007 2008 2009 Year Figure 13.6.2(b): Diastolic BP, 2006-2009 17th MDTR report 2009, Malaysia
Table 13.6.3: CKD stages, 2006-2009 17th MDTR report 2009, Malaysia