Download
1 / 15
150 likes | 252 Views
Bridged-Race Population Estimates for Chicago. 6 June, 2004 NAPHSIS – Portland, OR Mark Flotow Illinois Center for Health Statistics. Why Bother?!. . . . and I quote: - “it (multiple-race responses) only represents a small fraction of the population”

E N D
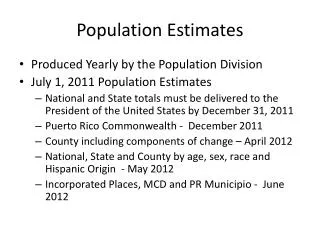
Bridged-Race Population Estimates for Chicago 6 June, 2004 NAPHSIS – Portland, OR Mark Flotow Illinois Center for Health Statistics
Why Bother?! . . . and I quote: - “it (multiple-race responses) only represents a small fraction of the population” - “it’s not an issue in my state; I have bigger things to worry about” - “it’s just a few places beyond the decimal point” - “ ” (i.e., don’t ask, don’t tell)
Population for Vital Rates Illinois – 2000 Census White alone = 9,125,471 73.478% Black or African American alone = 1,876,875 15.113% Asian alone = 423,603 3.411% American Indian and Alaska Native alone = 31,006 0.250% Native Hawaiian and Other Pacific Islander alone = 4,610 0.037% Some Other Race = 722,712 5.819% [ Two or more races = 235,016 1.892% ] Any two races = 223,969 1.803% Any three races = 10,116 0.081% Any four races = 720 0.006% Any five races = 180 0.001% Six races = 31 0.000%
Population for Vital Rates Illinois – 2000 Census Alone or in Percent Race Category Alone Combination Difference Difference White 9,125,471 9,322,831 197,360 2.2% Black or African American 1,876,875 1,937,671 60,796 3.2% Asian, Hawaiian and Other Pacific Islander 428,213 485,497 57,284 13.4% American Indian and Alaska Native 31,006 73,161 42,155 136.0% Some Other Race 722,712 847,369 124,657 17.2% All Races 12,184,277 12,666,529 482,252 4.0%
Population for Vital Rates Cook County – 2000 Census Alone or in Percent Race Category Alone Combination Difference Difference White 3,025,760 3,136,480 110,720 3.7% Black or African American 1,405,361 1,435,781 30,420 2.2% Asian, Hawaiian and Other Pacific Islander 262,731 294,251 31,520 12.0% American Indian and Alaska Native 15,496 33,941 18,445 119.0% Some Other Race 531,170 619,239 88,069 16.6% All Races 5,240,518 5,519,692 279,174 5.3%
Population for Vital Rates Chicago – 2000 Census Alone or in Percent Race Category Alone Combination Difference Difference White 1,215,315 1,282,320 67,005 5.5% Black or African American 1,065,009 1,084,221 19,212 1.8% Asian, Hawaiian and Other Pacific Islander 127,762 145,132 17,370 13.6% American Indian and Alaska Native 10,290 20,898 10,608 103.1% Some Other Race 393,203 452,255 59,052 15.0% All Races 2,811,579 2,984,826 173,247 6.2%
Bridged-Race Population Estimates for ChicagoSteps in the Process Objective: Bridged-race category population estimates for Chicago by age, sex and Hispanic ethnicity for 1 April, 2000 Givens: - decennial census counts for Chicago by 63 race categories, five-year age groups, sex and Hispanic ethnicity - Modified Race (MR) file for Cook County by 31 race categories, five-year age groups, sex and Hispanic ethnicity (from the Census Bureau) - bridged-race category estimates for Cook County by 4 race categories (based on 1977 OMB Directive #15), five- year age groups, sex and Hispanic ethnicity (from NCHS) - nationally-developed, based on NHIS data, bridged-race category logistic regression algorithms (from NCHS)
Bridged-Race Population Estimates for ChicagoSteps in the Process Assumptions: - the bridged-race category logistic regression algorithms from NCHS for Cook County will apply equally well for Chicago - an MR file can be created for Chicago that duplicates or simulates the MR file construction for counties performed by the Census Bureau
Bridged-Race Population Estimates for ChicagoSteps in the Process Step 1: - create an MR file for Chicago from the 2000 decennial census counts - reduces the number of race categories from 63 to 31 by eliminating the “Some Other Race” category - this is the same starting point that NCHS and the Census Bureau used to create a bridged-race file at the county level Step 2: - calculate the single-race category probabilities for each multiple-race category - apply the Cook County values to the logistic regression equation variables - results in probabilities between 0 and 1 for each single-race category by age/sex/Hispanic
Bridged-Race Population Estimates for ChicagoSteps in the Process Step 3: - apply the resulting probabilities for each age/sex group to the estimated Chicago MR file - gives population estimates for each of the four race categories - mitigate any possible raking and rounding issues to an independent Chicago population total
Bridged-Race Population Estimates for ChicagoResults Chicago – 2000 Census to MR File Race Category 2000 Census MR File Percent Difference White alone 1,215,315 1,644,143 35.3% Black or African American alone 1,065,009 1,077,282 1.2% American Indian and Alaska Native alone 10,290 12,941 25.8% Asian, Hawaiian and Other Pacific Islander alone 127,762 134,517 5.3% Some Other Race 393,203 -- -- Multiple-Race Categories 84,437 27,132 -67.9% All Races 2,896,016 2,896,016
Bridged-Race Population Estimates for ChicagoResults Chicago – MR File to Bridged-Race Estimates Race Category MR File Bridged Race Percent Difference White alone (White) 1,644,143 1,655,862 0.7% Black or African American alone (Black) 1,077,282 1,086,254 0.8% American Indian and Alaska Native alone (NA) 12,941 15,044 16.3% Asian, Hawaiian and Other Pacific Islander alone (API) 134,517 139,052 3.4% Multiple-Race Categories 27,132 -- -- All Races 2,896,016 2,896,212
Bridged-Race Population Estimates for ChicagoResults Chicago – 2000 Census to Bridged-Race Estimates Race Category 2000 Census Bridged Race Percent Difference White alone (White) 1,215,315 1,655,862 36.2% Black or African American alone (Black) 1,065,009 1,086,254 2.0% American Indian and Alaska Native alone (NA) 10,290 15,044 46.2% Asian, Hawaiian and Other Pacific Islander alone (API) 127,762 139,052 8.8% Some Other Race 393,203 -- -- Multiple-Race Categories 84,437 -- -- All Races 2,896,016 2,896,212
Why We Bothered(The Devil Made Us Do It) - the “devil” was in the details, as population denominators and their justification - we were “bedeviled” by the intricacies of the process - “deviled if you do, deviled if you don’t”
Contact information: Mark Flotow Illinois Center for Health Statistics Illinois Department of Public Health 525 West Jefferson Street Springfield, IL 62761 Telephone: (217) 785-1064 Fax: (217) 785-4308 E-mail: mflotow@idph.state.il.us