
Understanding Histograms: Visualizing Frequency Distributions in Data Sets
A histogram is a graphical representation that displays the frequency distribution of numerical data. For example, given the set {1,2,2,3,3,3,3,4,4,5,6}, we can create a histogram to visualize the frequency of each number. In real-world data, many numbers may be unique, making it necessary to use ranges for effective representation. A well-defined peak in a histogram indicates a significant answer, while low peaks suggest less importance. Analyzing these peaks can provide insights into the occurrence range and underlying patterns of the data.

Understanding Histograms: Visualizing Frequency Distributions in Data Sets
E N D
Presentation Transcript
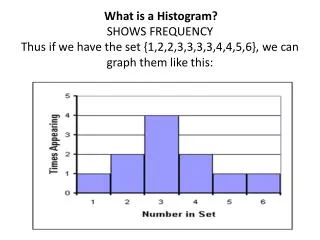
What is a Histogram?SHOWS FREQUENCYThus if we have the set {1,2,2,3,3,3,3,4,4,5,6}, we can graph them like this:
In most real data sets almost all numbers will be unique. Consider the set {3, 11, 12, 19, 22, 23, 24, 25, 27, 29, 35, 36, 37, 38, 45, 49} • Instead, USE A RANGE
The higher the peak, the more likely that is the “answer” Well defined peak…low peaks insignificant
What does this histogram tell you? Fairly close peak…less defined. Can determine a range of occurrence.
What does this peak tell you? No ONE definite peak….no definite answer


