Download
1 / 1
10 likes | 93 Views
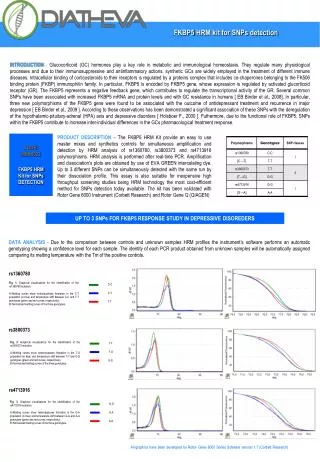
The FKBP5 HRM Kit offers easy simultaneous amplification and detection of FKBP5 gene polymorphisms for studying glucocorticoid response in depressive disorders. The assay is cost-efficient and suitable for high-throughput screening. Data analysis is automated with graphical visualization of melting curves. The kit is validated for Rotor-Gene instruments.

E N D
T-T T-G G-G C-C C-T T-T G-G G-A A-A INTRODUCTION-Glucocorticoid (GC) hormones play a key role in metabolic and immunological homeostasis. They regulate many physiological processes and due to their immunosuppressive and antinflammatory actions, synthetic GCs are widely employed in the treatment of different immune diseases. Intracellular binding of corticosteroids to their receptors is regulated by a proteins complex that includes co-chaperones belonging to the FK506 binding protein (FKBP) immunophilin family. In particular, FKBP5 is encoded by FKBP5 gene, whose expression is regulated by activated glucorticoid receptor (GR). The FKBP5 represents a negative feedback gene, which contributes to regulate the transcriptional activity of the GR. Several common SNPs have been associated with increased FKBP5 mRNA and protein levels and with GC resistance in humans [ EB Binder et al., 2008]. In particular, three new polymorphisms of the FKBP5 gene were found to be associated with the outcome of antidepressant treatment and recurrence in major depression [ EB Binder et al., 2009 ]. According to these observations has been demonstrated a significant association of these SNPs with the deregulation of the hypothalamic-pituitary-adrenal (HPA) axis and depressive disorders [ Holsboer F., 2000 ]. Futhermore, due to the functional role of FKBP5, SNPs within the FKBP5 contribute to increase inter-individual differences in the GCs pharmacological treatment response. PRODUCT DESCRIPTION –The FKBP5 HRM Kit provide an easy to use master mixes and synthetics controls for simultaneous amplification and detection by HRM analysis of rs1360780, rs3800373 and rs4713916 polymorphisms. HRM analysis is performed after real-time PCR. Amplification and dissociation's plots are obtained by use of EVA GREEN intercalating dye. Up to 3 different SNPs can be simultaneously detected with the same run by their dissociation profile. This assay is also suitable for inexpensive high throughput screening studies being HRM technology the most cost-efficient method for SNPs detection today available.The kit has been validated with Rotor Gene 6000 Instrument (Corbett Research) and Rotor Gene Q (QIAGEN) UP TO 3 SNPs FOR FKBP5 RESPONSE STUDY IN DEPRESSIVE DISOREDERS DATA ANALYSIS - Due to the comparison between controlsand unknown samples HRM profiles the instrument’s software performs an automatic genotyping showing a confidence level for each sample. The identity of each PCR product obtained from unknown samples will be automatically assigned comparing its melting temperature with the Tm of the positive controls. rs1360780 • Fig. 1: Graphical visualizations for the identification of the rs1360780 mutation. • Melting curves show heteroduplexes formation in the C-T population (in blue) and temperature shift between C-C and T-T genotypes (green and red curves, respectively). • Normalized melting curves of the three genotypes. rs3800373 • Fig. 2: Graphical visualizations for the identification of the rs3800373 mutation. • Melting curves show heteroduplexes formation in the T-G population (in blue) and temperature shift between T-T and G-G genotypes (green and red curves, respectively). • Normalized melting curves of the three genotypes. rs4713916 • Fig. 3: Graphical visualizations for the identification of the rs4713916 mutation. • Melting curves show heteroduplexes formation in the G-A population (in blue) and temperature shift between G-G and A-A genotypes (green and red curves, respectively). • Normalized melting curves of the three genotypes. All graphics have been developed by Rotor- Gene 6000 Series Software version 1.7 (Corbett Research)